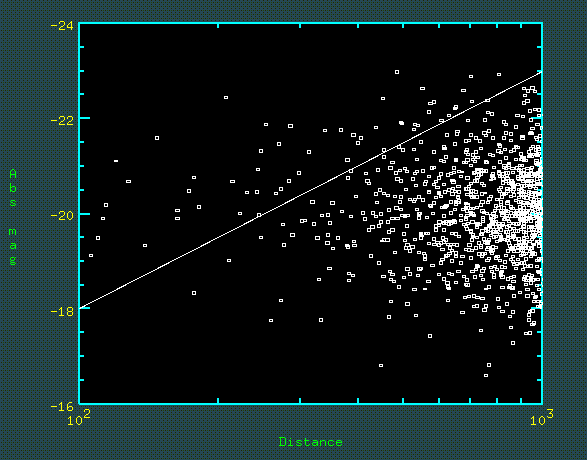
Artificial sample of galaxies with a Gaussian luminosity distribution. On this plot of Log Luminosity (Absolute Magnitude) against Log distance, the galaxies exhibit the Gaussian distribution at every distance, but because there is less volume at smaller radii, there are fewer on the left.
A line of constant flux is shown (gradient 5 on this magnitude vs log distance graph), so if the survey was complete to this flux, then no galaxies below the line would be included. Clearly, the resulting luminosity distribution of the galaxies in our sample is highly skewed to high-luminosity objects.
This tendency for flux limited surveys to over-represent high-luminosity objects is called the "Malmquist Bias".