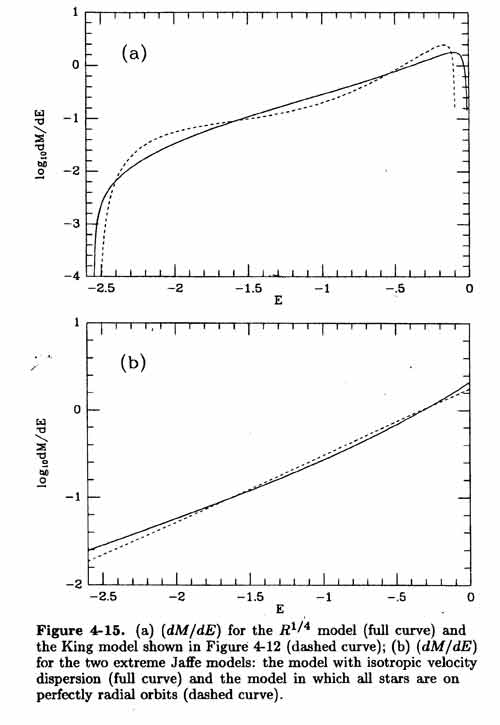
In this figure, the integral over the phase space has been done, so now we can see the relative number of stars in the entire system with a given energy. Now, the curves increase to higher E, and are highest for nearly unbound stars (near E = 0). The top shows the N(E) for the deVaucouleurs (solid) and King (dashed) systems -- note the King curve has N(E) drop to zero below E = 0 because tidal truncation ensures there are no marginally bound stars with E = 0. Below are N(E) for the Jaffe model with isotropic (solid) and purely radial (dashed) velocity fields.
Note that the x-axis is Log E, while the y-axis is Log dM/dE, so the relative number is not given by the relative area under the curve. We would need to plot Log E dM/dE to show that.