Abundance of the Elements
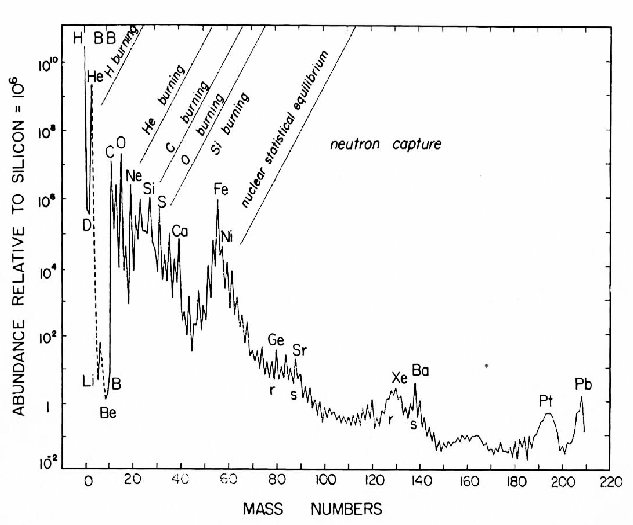
Figure 11 : A graph showing the relative abundances of all the elements up to Lead (82), as measured in the solar system and nearby stars. The vertical axis spans a huge range, from the rarest elements (0.1) to Hydrogen (over ten billion), with the scale set so that silicon is a million. The horizontal axis shows the elements, ordered not by the number of protons but by the sum of protons and neutrons (which allows all isotopes to be included). A few elements are labelled by their chemical symbols -- e.g. peaks at iron (Fe), Xenon (Xe), Barium (Ba), Platinum (Pt), and Lead (Pb). Overall, lighter elements are more common than heavier elements, but there is considerable systematic variation, with several peaks and a strong saw-tooth alternating pattern. Detailed calculations of stellar furnaces account for essentially all these features. Illustrating this, the products of various thermonuclear fuels are indicated, as well as supernova explosions (the iron peak elements), and the various peaks arising from rapid ("r") and slow ("s") neutron capture. The lightest four elements are NOT made in stars, but come from hydrogen burning in the Big Bang. The figure is taken from Pagel (1997) who adapted it from Cameron (1982).