Gray-Scott Model at F 0.1020, k 0.0570
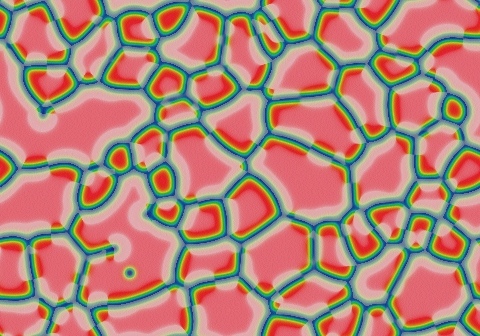
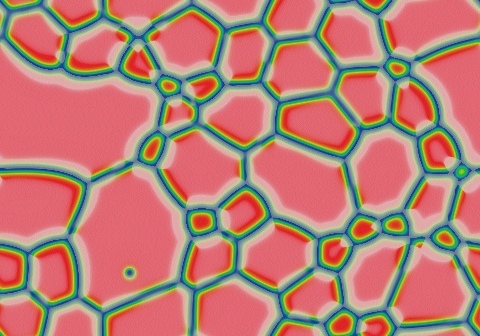
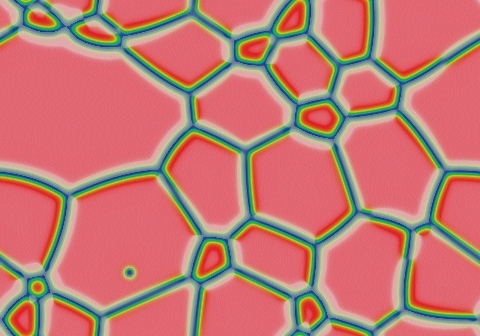
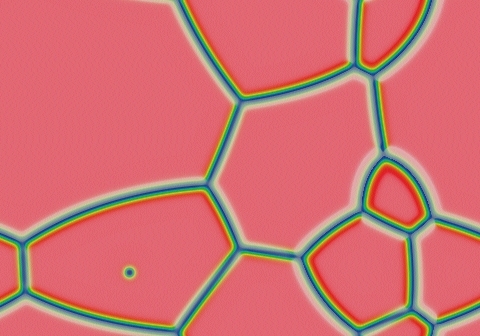
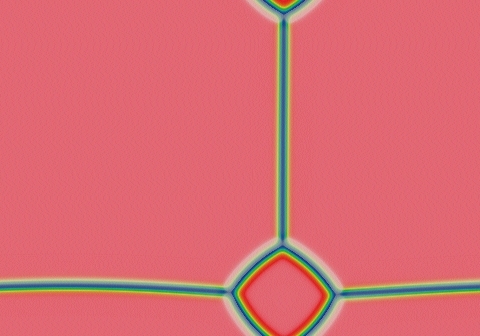
These images and movie demonstrate the behavior of the Gray-Scott reaction-diffusion system with σ=Du/Dv=2 and parameters F=0.1020, k=0.0570.
Blue spots on a red background form solitons and worms that quickly shrink to solitons.
Red spots on blue (as seen here) form "bubbles" (a network of connected lines); bubbles with fewer than six sides tend to shrink, ceding their space to neighboring bubbles with six or more sides. Solitons trapped inside a shrinking bubble vanish when their bubble gets too small (1:00-1:10).
Categories: Munafo ρ; Wolfram 2-a (glossary of terms)
 increase F increase F
 | |||
 decrease k  |
|
15 frames/sec.; each fr. is 736 iter. steps = 368 tu; 2201 fr. total (809,968 tu) |  increase k 
|
|
| ||
 decrease F decrease F
 |
In these images:
- Color indicates level of u, ranging from purple (lowest u values) through blue, aqua, green, yellow and pink/red (highest u values)
- Areas where u is increasing are lightened to a light pastel tone; where u is decreasing the color is vivid.
- In areas where u is changing by less than ±3×10⁻⁶ per tu, an intermediate pastel color is seen. This includes areas that are in steady state or equilibrium.
''tu'' is the dimensionless unit of time, and ''lu'' the dimensionless unit of length, implicit in the equations that define the reaction-diffusion model. The grids for these simulations use Δx=1/143 lu and Δt=1/2 tu; the system is 3.2 lu wide. The simulation meets itself at the edges (periodic boundary condition); all images tile seamlessly if used as wallpaper.
Go back to Gray-Scott pattern index
This page was written in the "embarrassingly readable" markup language RHTF, and was last updated on 2019 Jan 05.
 s.11
s.11