Universality-Complexity Classes for Partial Differential Equation Systems
This classification applies to continuous, real- or vector-valued systems in which the time derivative has "almost-everywhere zero" characteristics. This means that the influence of the present state at time t on the state at time t+ε is localized. This criterion applies to Reaction-diffusion systems but not if such systems have a global integration term (a term that incorporates a sum, possibly weighted, across the entire domain — an example of a PDE system with a global integration term is seen in the Purwins and Stollenwerk AC gas discharge experiments[3]).
(If you are interested in Gray-Scott specifically, see the more detailed taxonomy Pearson's Classification (Extended) of Gray-Scott)
The qualitative descriptions given here are analogous to, and partly based on, those defined by Wolfram [1] for discrete cellular automata.
In the following, w is the width of the system (its largest dimension in space, in dimensionless units), t represents a quantity of time, O() is an expression of approximate magnitude similar to the Big O notation, K is an arbitrary constant.
These classes also apply to one-dimensional continuous real-valued systems; see Gray-Scott reaction-diffusion system in one dimension for some illustrations.
Class 1
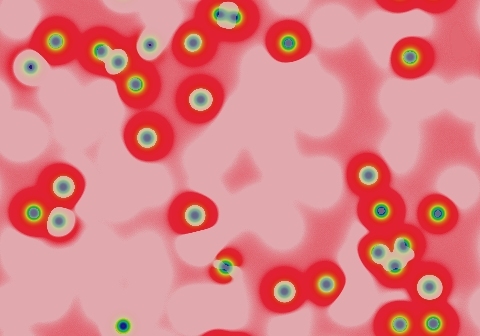
Class 1 systems evolve, within a bounded finite period of time of order t ≈ O(wK), into a homogeneous state. K depends on the density of the starting pattern according to some system-specific measure; for example in the images shown here, the density of blue spots in the starting pattern is what matters. There can be one or more homogeneous states for a system, analogous to multiple basins of attraction for a scalar-valued system.
Examples
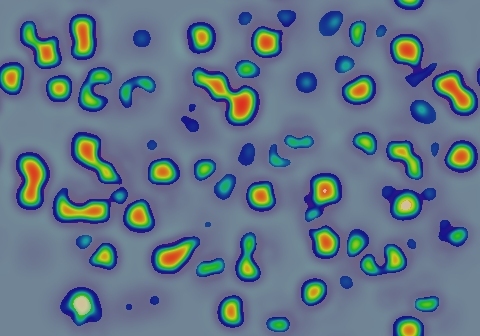
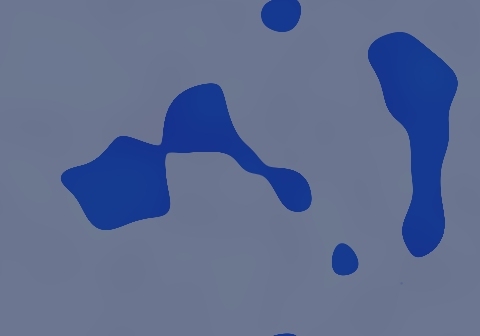

K<<1 due to density of starting pattern. This system oscillates in ∂u/∂t for a while, then stops changing.
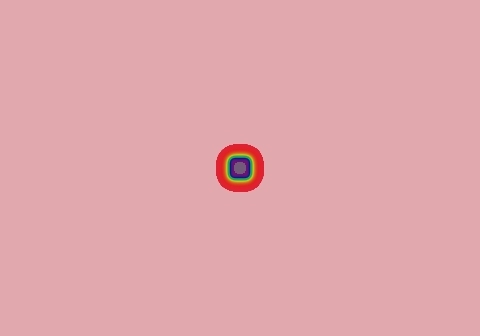
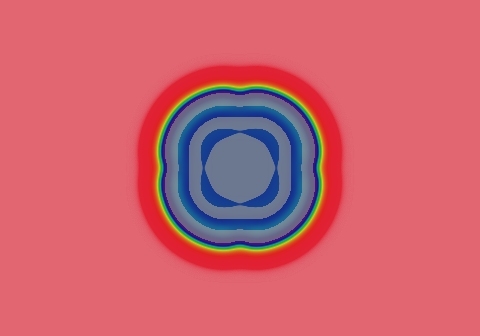

1.2 Same F and k; K≈1 due to single small localized seed pattern.
Not shown: A pattern that starts out solid "pink" will remain (this is a second homogeneous state)
Class 2
Class 2 systems convert localized areas of "input" (initial state) into one of a small set of localized "output" (evolved state) pattern-classes, within a time of order t ≈ O(1). Each localized area of the system evolves into an output pattern more or less independently of what is happening elsewhere. Any given localized input can be characterized in some way that deterministically predicts the resulting output pattern. Details of the characterization depend on the system, but they will generally be "well-behaved", in the sense that is qualitatively similar to "well-behaved" functions that are continuous, continuously-differentiable, and that have a small finite number of singularities or discontinuities. This all means that each localized region of the resulting pattern depends only on the local area of the input pattern: nothing will ever invade from a distant region of the domain (compare to class 2-a below).
After the time of order t ≈ O(1), further evolution of the system is qualitatively insignificant on timescales of order t ≈ O(K w) although evolution on the order t ≈ O(eKw) may or may not be qualitatively different. This means that very slow, but asymptotically significant, changes may occur. In the example system shown here, the spots continue to move at a velocity c≈Ke-49d with K≈0.065 lu tu-1. It takes a truly immense amount of time (roughly 1012 tu by my calculations) for these 31 solitons to even begin to approximate the final pattern, which is a hexagonal grid like that seen in one of the class 3-a examples below, with the individual solitons spread out evenly across the entire domain.
Example
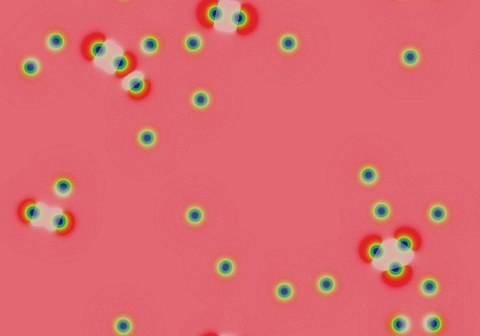
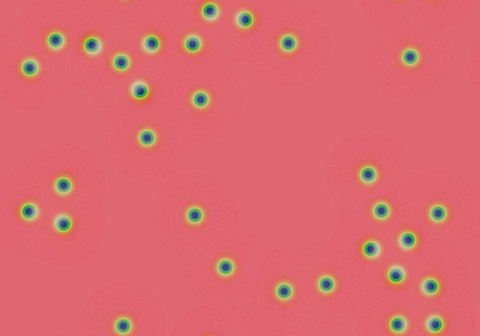
Spots continue to move with velocity v≈K/t, K is very small.
Class 2-a
Class 2-a is a subset of class 2 from the Wolfram viewpoint, but distinct in important ways for continuous-valued systems. They start out like class 2, but eventually fill the space with a pattern that then asymptotically approaches a static state. Forming this static state can take a polynomial long time to form, t ≈ O(wK), with K≥1. In Gray-Scott and most systems exhibiting systematic growth, the exponent K is close to 1. An example of K=2 is a system consisting of a finite number of stripes (worms) that grow from both ends until filling the space (second example shown).
Another way to think of class 2a is that it combines features of classes 1 and 2. Certain "benign" starting patterns, like the solitons seen in the second example, behave like class 2, but other "cascade-inducing" patterns, like the two types of growing patterns seen here, make it behave like class 1. Example 2.3 mixes benign solitons and growing "worms" in the same pattern. In class 2-a, unlike class 1, you never get an "all-blue" homogeneous state.
Examples
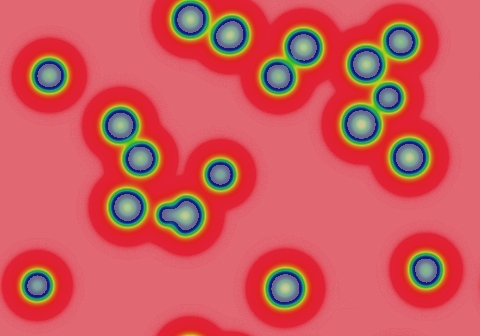
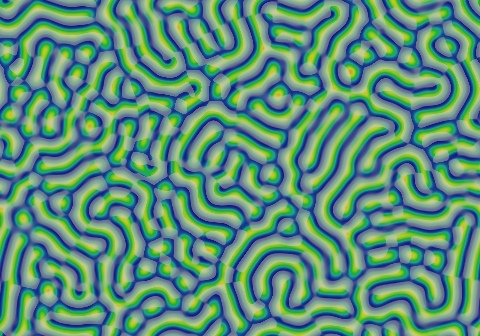
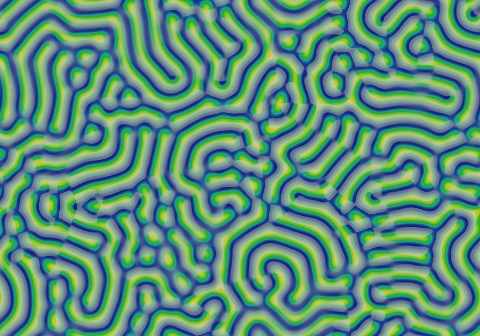
Exponent K≈1. These spots took about 4000 tu to fill the space.
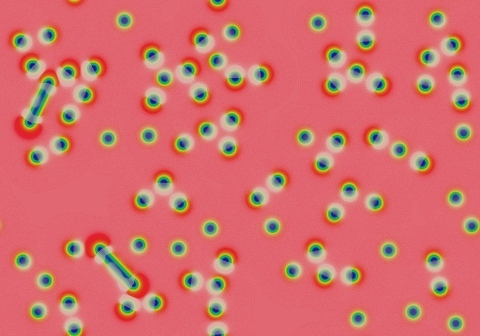
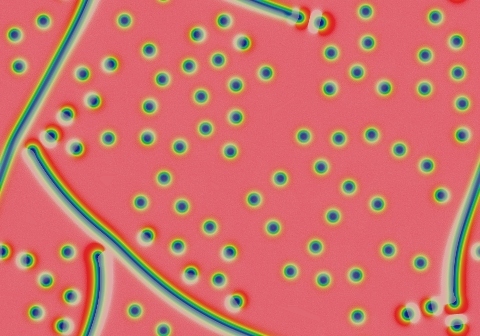
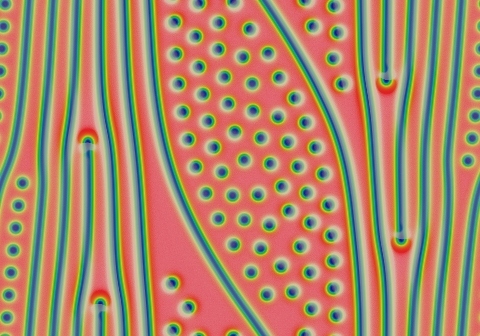
Exponent K≈2. These two worms took about 1,200,000 tu to fill the space.
Class 3
Class 3 systems evolve from nearly any starting state into continued, unending spatio-temporal chaos. The state at time t ≈ O(K w) is qualitatively similar to states at all subsequent times. For practical purposes this is like class 2a except that motion and change continue forever.
Example
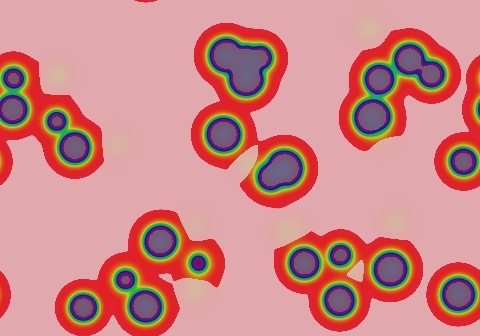
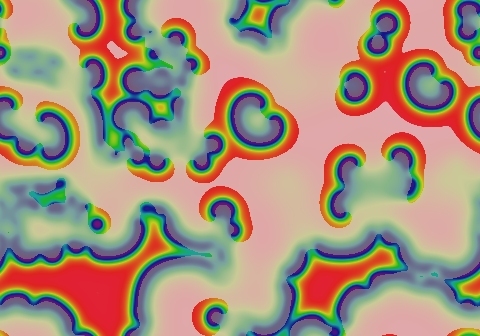
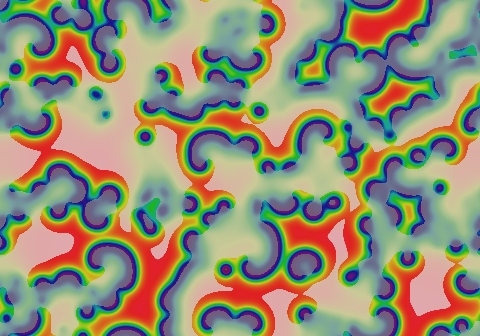
Class 3-a
Class 3-a is a subset of class 3 from the Wolfram viewpoint, but distinct in important ways for continuous-valued systems. These start out like class 2, but eventually fill the space with a pattern that then continues to evolve in a long-term unpredictable way. Like the rest of class 3, this continually evolving state is qualitatively similar at all times after the initial filling of space. However, unlike normal class 3 systems, which exhibit "homogeneous chaos", type 3a has a lot of localized stability for fairly significant periods of time — the chaos only covers a small fraction of the space at any given time. In each of the following examples, most of the motion is in the ∂u/∂t component; the spots and stripes seen in the rightmost frames remain for a long time. Spots and bits of stripes die out gradually to be replaced by something new — so if you wait long enough, the entire pattern will change, but that can take a really long time. A significant distinction, and the reason why this is class 3 and not class 2 or 4, is that the average rate of change approaches a nonzero constant.
Examples
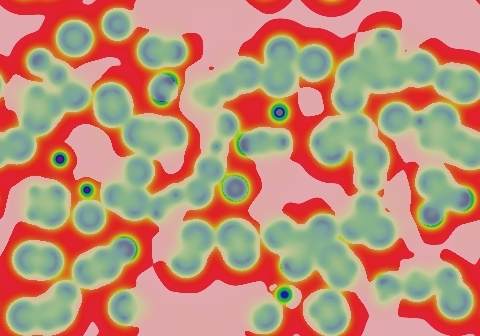
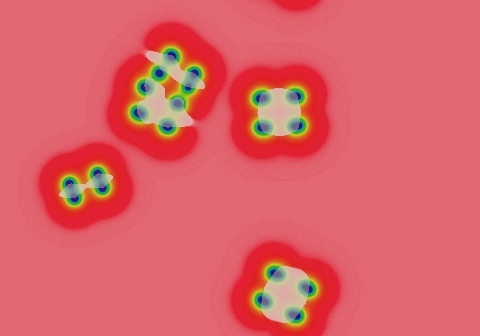
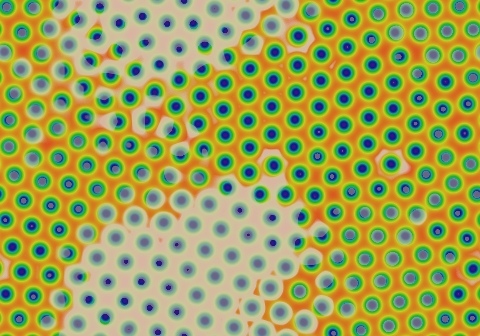
Pattern stops moving, but pulsation in ∂u/∂t continues indefinitely
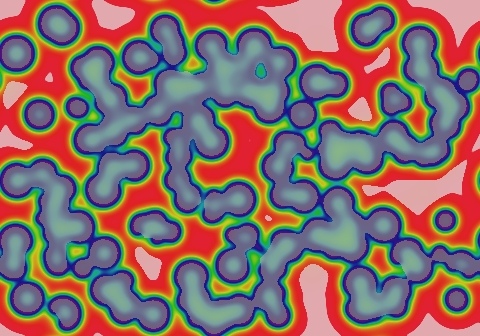
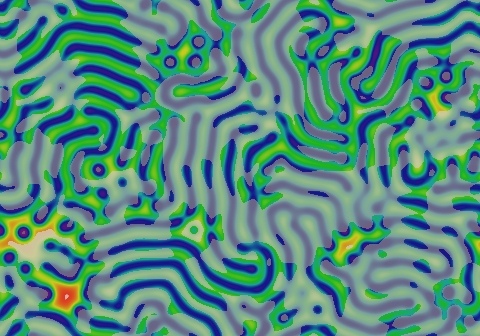
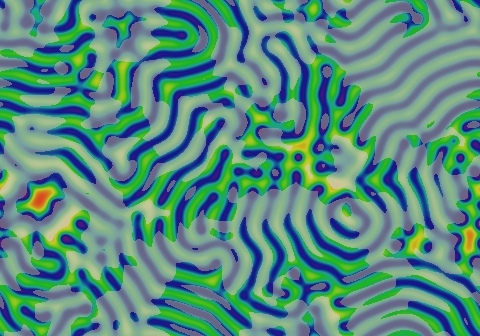
Stripes slowly change due to occasional localized die-offs
Class 4
Class 4 systems will usually, but significantly not always, evolve into an essentially unchanging state. However, there is no easy way to predict the evolution in terms of any characterization of the starting state. A substantial fraction of starting states will take a very long time to stop evolving. As with the chaotic (class 3) systems, the fate of a starting pattern varies greatly with very small changes to the starting pattern; unlike class 3 systems, class 4 systems do eventually stop evolving.
The inherent unpredicability of class 4 patterns allows for, but does not guarantee, the possibility that the system is a class 4-a system.
For a second example, that of (F=0.06, k=0.0609), read my paper "Stable localized moving patterns in the 2-D Gray-Scott model" (preprint here). Also check out the extensive catalog of patterns and the general discussion of (F=0.06, k=0.0609) phenomena on this page.
Example
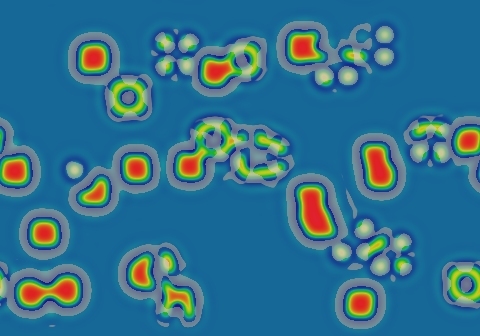
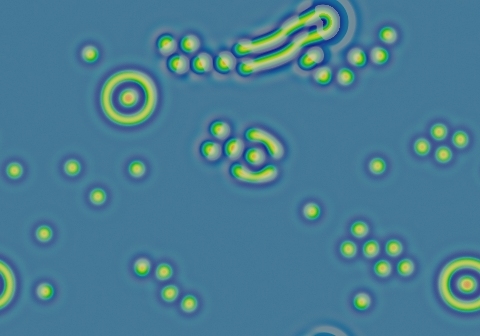
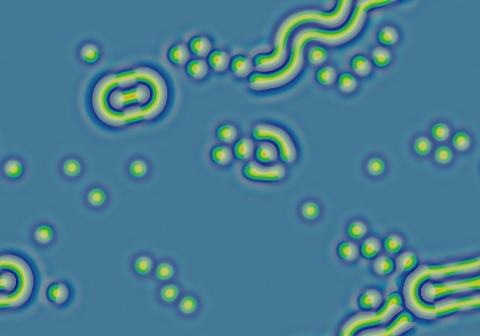
Diversity of growing, stationary, rotating and moving patterns, all either partly or completely stable
Class 4-a
Class 4-a systems are subject to a "halting problem" like that of computation. This does not necessarily mean that the system is actually capable of universal computation, just that it is subject to a halting problem: There is no way to determine, by looking at the starting pattern, how long it will take to reach an unchanging final state (if any), other than simply running a simulation to see how the system evolves.
No example has yet been proven — However, read the paper and links cited in Class 4 above, and if you feel inspired, create your own patterns at these parameter values, to see what is possible!
Automated Classification
There are a number of issues yet to be overcome before a classification study analogous to that of [1] can be performed.
Defining the Set of Starting Patterns
Wolfram [1] dealing with discrete cellular automata performed an automated statistical analysis and classification of celular automata systems, by automatically generating starting patterns from a universe of possible choices and watching what happens (as measured by certain statistics). As pointed out by others (see [2]) such studies are subject to "finite size effects" resulting from the fact that the automatic measurement must stop at some finite size domain and number of time steps; this problem will also be present in any work on continuous real-valued systems.
In addition to size effects, there is a problem of determining how to cover the set of possible states for a given system. Two principles of the geometry of point sets combine to make things difficult:
- Whereas the universe of starting patterns for discrete cellular automata on a finite domain is א0, and such a universe is can usually be shown to be adequate to characterize the system on infinite domains, the universe of starting patterns for a continuous real-valued system, even on finite domains, is א2.
- A universe of א2 starting functions cannot be accurately characterized by any automatic statistical sampling method, unless that method is certified via human intelligence. In general, this is just because no finite set of sample points can come close enough to all of the points in the "space of measure א2". In particular, there is a need to analyze the PDE functions to define equivalency classes for the starting patterns and parameter values and prove that nothing is being missed. In the Gray-Scott system, for example, there are many parameter values at which you won't get anything interesting unless your starting pattern includes regions that fall into both basins of attraction (above and below the blue state created by the saddle-node bifucation). In many cases, this type of analysis is a deep unsolved problem in its own right.
In order to address this, for any systems for which the analysis problem appears intractable, another option is available: The universe of initial states can be explicitly defined by a starting pattern function, and this function can be taken to be a part of the definition of the system to be classified. If the definition is precise enough, the universe of possible patterns could be made finite, or at least brought down to a number (like א0) that can more comfortably be chracterized by a finite sample set.
For the above examples, this amounts to re-considering the problem for different types of starting patterns. Consider the two examples shown above for Class 1. The leftmost image of each example was evolved from the starting pattern in a very small number of time-steps. A clear difference is seen — blue background with lots of yellow/orange spots, versus red background with a single blue spot. The first represents a starting pattern function that randomly generates a large number of rectangular spots with random positions. The second is a starting pattern "function" that always generates the same starting pattern: a single rectangular spot. Both have superimposed noise, but for the parameters in question, the noise quickly smooths out and the large spots ar all that matter. If we consider the initialization function to be a part of the definition of the system, the first type of starting pattern would have א0 or א1 possible forms; the second starting pattern has 1 (a finite number) of forms. In either case, getting an accurate statistical measure of the behavior of the system seems more feasible.
Back to main menu
References
[1] S. Wolfram, Universality and complexity in cellular automata, Physica D: Nonlinear Phenomena 10 (1984) 1-35.
[2] Lawrence Gray, A mathematician looks at Wolfram's new kind of science, Notices of the AMS 50 (2) (2003) 200-211.
[3] Lars Stollenwerk, "Pattern formation in AC gas discharge systems", website of the Institute of Applied Physics, WWU Munster, 2008
[4] Robert Munafo, Stable localized moving patterns in the 2-D Gray-Scott model (2009) available here.
This page was written in the "embarrassingly readable" markup language RHTF, and was last updated on 2019 Jan 05.
 s.11
s.11