Whittle : EXTRAGALACTIC ASTRONOMY


13. GALAXY GROUPS & CLUSTERS


(1) Introduction
Lets start by identifying some of the salient features of galaxy clusters.
- Typical cluster sizes are
 1 - 3 Mpc :
 they are the largest virialized structures in
the Universe (ie
they are the largest virialized structures in
the Universe (ie  KE
½ PE )
[movie 38Mb!]
KE
½ PE )
[movie 38Mb!]
Structures larger than clusters have not had time to "turn around", collapse,
and virialize.
Galaxies : tvirial 108
yr <<< tHubble
Clusters : tvirial 109
yr << tHubble
Superclusters : tvirial 1010.5
yr > tHubble
Note that clusters are not necessarily the largest bound structures
in the universe
superclusters may be bound, but
haven't yet turned around and virialized.
-
On these large scales, components have not had a chance to separate during
collapse
a cluster is probably a representative
sample of the Universe
This is important when, for example, we measure their Dark Matter (DM)
content :
(MDM / Mbaryons)cluster =
(MDM / Mbaryons)Universe
So a measurement in clusters can be scaled up to derive  matter for the universe
-
The richest clusters are typically found at the intersection of sheets
and filaments of galaxies
e.g. Coma is located at an intersection in the great wall :[image]
Movie of Large Scale Structure formation, showing clusters at intersections: [movie 7Mb]
Movie of 3D-fly-through the end-point: [movie - 57 Mb!]
Ongoing heirarchical assembly : small
things merge to make bigger things, on all scales.
Clusters continue to grow
(and form), even today
- Cluster are part of a continuous range of structures :
galaxies groups clusters superclusters large scale
structure
However, clusters are rare extremes in the galaxy distribution,
with 
 / <> 103 :
Very roughly (depending on definitions) the total galaxy content of the universe
is divided :
1-2% in rich clusters
5-10% in clusters
50-100% in "Local Group"s &/or looser groupings
- The four principal constituents of clusters include: [image]
- Galaxies
- Intracluster Stars
very faint (0.1% sky) diffuse light (distinct from
cD halo light)
comprises 10-50% total galaxy light (in rich
clusters; much less in poor clusters)
probably tidally stripped stars [images & movies]
- Hot Gas
Hydrostatic atmosphere [image]
T 107-8K X-ray emitter
n 10-3 cm-3
L 1043-46 erg/s 10-2 - 10-4 Lopt
Mgas 5 × Mgals
Z 0.3 Z enriched : not all primordial
- Dark Matter
Dominates the total mass [image]
MDM 4 × Mgas + gals

(2) Cluster Surveys and Catalogs
(a) Optical Identification
One needs to identify an "overdense" region of galaxies
Early steps : Herschel(s); Hubble; Shapley; Reynolds.
Significant improvement following publication of the northern Palomar Sky Survey (PSS-I)
Historically leaning review of clusters by Biviano is here: [o-link]
(i) Abell (1958) : Catalog of Rich Clusters
A definitive work (o-link) which has survived to current times
Visual inspection of 104 deg2 from PSS yielding
2712 clusters
Southern extension using SRC-J : 1364 clusters (o-link)
Robust criterion :
estimate distance using m10 (10th brightest galaxy)
exclude clusters with 0.02 < z > 0.2 (note : Virgo excluded --
too close/big)
define region of radius 1.5 h-1 Mpc (an "Abell Radius", RA)
count galaxies within RA between magnitudes m3 and m3 + 2
subtract a background count evaluated nearby
N > 50 "complete catalog"
(adding : 800 >  < 1200 km/s eliminates 10%
superpositions)
< 1200 km/s eliminates 10%
superpositions)
Richness classes 1-2-3-4 : N = 50 - 80 - 130 - 200 - 300
(comprising 1224, 383, 68, 6 clusters)
N = 30 - 49 "incomplete catalog"
(1030 clusters, Richness class 0)
Data on the Abell clusters compiled by Struble & Rood : 1987 ApJ Supp
63, 543 & 555
Basic data and links to SDSS images of all Abell clusters is here: o-link
(ii) Zwicky (1961-68) : Catalog of Galaxies and Clusters of Galaxies
18 inch Schmidt gave mB for 31,000 galaxies, visual inspection of
PSS gave 10,000 clusters.
Assigned cluster type : Compact, Medium-Compact, Open
Assigned cluster distances : Very Near, Near,
Distant, Very Distant, Extremely Distant.
Gave number of galaxies, cluster boundary size, coordinates etc.
Uses "isopleth" density contrast of N / Nbackground = 2 to
define cluster
however, statistically incomplete :
cluster sizes are distance dependent
rarely used compared to Abell's lists
(iii) Automated Digital Catalogs
Possibly more objective selection criterion uses automated recognition of galaxies and clusters.
Earlier work (1970s-1990s): scanning of UK schmidt plates (SRC J & R)
More recent: SDSS has generated many catalogs: e.g. o-link
These use groupings in both space and redshift (spectroscopic and/or photo-z).
(b) X-ray Identification
Rich clusters with deep potentials have hot gas (§ 10)
X-ray emission is an effective way to find relaxed clusters
Since emissivity  n2, we have no forground X-ray emission (though smooth X-ray background)
problems of spurious identification
from superposition is greatly reduced compared to optical surveys.
At high redshifts, this is increasingly important
X-ray surveys may be the best way to identify (rich) high-z clusters
Several surveys currently exist:
EMSS (Einstein Medium Sensitivity Survey : serendipitous, 800 deg2,
z 0.05 - 0.55)
RDCS (ROSAT Deep Cluster Survey : serentipitous, 100 deg2, z  1)
1)
RASS (ROSAT All Sky Survey)
XCS (XMM-Newton)
(c) Other Methods of Identification
There are a few other methods which show great promise for the future :
- SZ (Sunyaev-Zeldovich) effect :
Hot cluster gas Compton scatters CMB photons, increasing their energy by ~kT/mec2
Look for brightening/dimmin of CMB at mm-wavelengths
Promising for detecting high-z clusters
Published catalogs: SPT, PLANCK, ACT.
- Weak Gravitational Lensing :
Faint background galaxies suffer slight distortion by matter along the line of sight
Intervening clusters give slight azimuthal image elongation
Many galaxies statistically detectable
Allows mapping of intervening mass distribution.
Benefit from space imaging, e.g. WFIRST.
- Color Search for Red Galaxies :
(Red) Ellipticals formed very early
so concentrations of faint red objects should yield high-z clusters
Redshift modifies colors, so good color information should also yield approximate redshift.
(3) Cluster Classification
-
Clusters are not all the same !
One might classify clusters according to one of several possible properties :
eg shape, richness, lumpiness, Hubble mix, dominant galaxy types, etc
it transpires (see below) that many of these are equivalent,
so in practice we need only keep track of one (or two) underlying properties.
-
A couple of classification schemes are in common use :
- Bautz-Morgan (BM) type : [o-link]
Compares the prominence of the brightest galaxy to the other galaxies.
| BM I | single central dominant cD galaxy | (eg
A 2199) |
| BM II | several bright galaxies between cD and
gE | (eg
Coma) |
| BM III | no dominant galaxy | (eg
Hercules) |
- Rood-Sastry (RS) type : [o-link]
Describes the distribution of the 10 brightest galaxies
Can be arranged in a "tuning fork" sequence: [image]
| cD | dominated by a single cD galaxy |
(eg A 2029) |
| B | dominated by a bright binary |
(eg Coma) |
| L | line of several bright galaxies |
(eg Perseus) |
| C | core of > 4 bright galaxies |
(eg A 2065) |
| F | flattened distribution |
(eg A 1291) |
| I | irregular with no center |
(eg Hercules) |
These two systems are closely related
it seems there is a primary factor which
defines a cluster : its degree of relaxation
from most relaxed to least relaxed we have :
BM : I II III
RS : cD B L C F I
A number of other properties follow this sequence :
Hubble type mix : Elliptical rich Spiral
Poor Spiral rich
Overall Shape : Spherical Intermediate
Irregular
X-ray Luminosity : High intermediate
low
Here is a more specific table (condensed from Bahcall's entry in Allen's AQ)
| Property/Class |
Regular |
Intermediate |
Irregular |
| Zwicky type | Compact | Medium-Compact | Open |
| Bautz-Morgan type | I, I-II, II | (II), II-III | (II-III), III |
| Rood-Sastry type | cD,B, (L,C) | (L),(F),(C) | (F), I |
| Content | Elliptical-rich | Spiral-poor | Spiral-rich |
| E:S0:S ratio | 3:4:2 | 1:4:2 | 1:2:3 |
| Symmetry | Spherical | Intermediate | Irregular shape |
| Central concentration | High | Moderate | Very little |
| Central profile | Steep | Intermediate | Flat |
| Mass segregation ? | Marginal | Marginal | None |
| Radio detection ? | 50% | 50% | 20% |
| X-ray luminosity | High | Intermediate | Low |
| Examples | A2199, Coma | A194, A539 | Virgo, A1228 |
It is very likely that this sequence reflects, at least in part,
stages in cluster evolution :
most evolved intermediate
least evolved
Stated slightly differently : given a few Gyr, Hercules will resemble Coma
of course, more clusters like Hercules will form out of yet lower density
regions.
(4) Important Timescales
(a) Crossing Time
(b) Violent Relaxation Time
(c) 2-Body Relaxation and Dynamical Friction Times
From Topic 8.10.a.iii we derived a simple formula for 2-body relaxation
(eq 8.38c) :
where N is the total number of interacting bodies in the system.
This gives 3 × 10⁹ yr (Table
in 8.9.b) which is quite short
However : lets not forget the Dark Matter --- how does this change things ?
When we have a background medium, the 2-body and dynamical friction
processes get entwined.
The timescale for significant energy loss becomes :
where fg is the fraction of mass in galaxies ( 0.1) and N is the total number of galaxies
For individual galaxies we get trelax
1011-12 yr while for subgroups (3-30 galaxies) this becomes
109-11 yr
So relaxation is generally not significant for most galaxies
However, for subgroups or galaxies near the center, some relaxation is
expected
Dont forget, this kind of relaxation leads to equipartition (in energy), so
massive galaxies will settle
Although massive galaxies are often found in cluster cores,
it is unclear if this is due to relaxation or merging.
(5) Cluster Shapes & Kinematics
(a) "Smoothed" Properties
(b) Substructures
(6) Two Nearby Examples : Virgo & Coma
Virgo and Coma provide nice examples of unrelaxed (Virgo) and relaxed
(Coma) clusters.
I did not have time to go over these in class, so for the moment I'll leave this
blank.
I'll include this section next time, since there are many interesting things
to learn from these two clusters.
(7) The Morphology-Density Relation
It is well known that the Spiral/Elliptical ratio is often lower in clusters
than the field.
We discussed this in terms of Luminosity Functions in
Topic 4.6
It seems the morphology of a galaxy depends (statistically) on its
environment
This "Morphology-Density Relation" is important since it clearly plays a
role in galaxy evolution :
-
Perhaps environmental density affects what kind of galaxy can form ?
-
Perhaps spirals are converted to ellipticals in dense environments ?
Lets look more closely at this topic.
(a) Early Work at Low Redshift
- Hubble and Humason (1931) notice that clusters have a higher
fraction of Es and S0s than the field.
>>> The morphological mix of galaxies depends on galaxy environment.
- Oemler (1974) recognised three types of cluster :
which correlated with overall cluster shape, galaxy density and degree of central concentration.
He suggests they represent a sequence in cluster dynamical evolution.
Here is a typical census :
| Type: |
cD |
E+S0 |
S+I |
| Rich clusters | 93 | 56 | 38 |
| Poor clusters | 6 | 20 | 14 |
| Field | < 6 | < 24 | 48 |
- Dressler (1980) classified 6000 galaxies in 55 clusters plus 15 field
regions.
He recorded positions and local projected galaxy density
(area enclosing nearest 10 galaxies brighter than Mv=-21.4 [H0=50]).
He found :
- Strong dependencies of f(Sp), and f(E) on projected local galaxy density
(figure)
- The dependency of f(S0) is weaker than f(E) or f(Sp)
- In poor clusters, the trend is stronger with local density than with simple cluster radius
(figure)
(b) Possibly Relevant Physical Processes
Overall, the interpretation of the morphology-density relation is still unclear.
Possibilities include :
- High densities inhibit the formation of spirals.
- Spirals may be stripped of gas (see below) to make S0s
- c.f. Amemic spirals (van den Bergh) are common in clusters
- But : B/D ratios in S0s are systematically higher than in spirals.
- However, maybe disks fade faster than bulges (since younger)
- Bulges may "grow" by accretion of dwarfs
- S0s may not be a homogeneous class : some originate as spirals, others not
- Spirals experiencing "harrassment" (Moore et al 1996) can resemble S0s.
rapid gravitational shocks disturb spiral structure and "heat" the disk stars.
- Spiral mergers may create S0s and/or Es.
(c) HI Deficiency - Stripping of Spiral HI Gas
One of the (several) possible environmental effects on galaxies in clusters
is the stripping of ISM due to ram pressure as the galaxy moves through
the ICM. Observational work in the 80s focussed on HI and CO :
- HI deficiency is defined as (M - <M>)/<M>, where
<M> is the mean HI mass for galaxies of the same Hubble type.
- HI deficiency is found to increase
(a) towards the center of clusters
(picture)
(b) in richer clusters of higher X-ray luminosity
(picture)
- However, whether this is sufficiently efficient is unclear :
(a) Studies show CO is not removed (denser and deeper in galaxy potential)
(b) Only the outer HI is stripped (eg HI
map of virgo shows smaller sizes in the core)
(d) Recent Work at High Redshift
Only with HST has it been possible to study morphology at high-z (z ~ 0.5;
lookback times ~6-8 Gyr).
This gives insight into whether the morphology-density
relation stems from galaxy formation or galaxy evolution.
HST studies find :
- f(E) is the same as low-z
- f(S0) is lower by factor 2-3
- f(Sp) is higher by factor 2-3
- The morph-density relation is absent in irregular clusters.
We conclude from this :
- Ellipticals formed earlier (at even higher z)
- For Es, the density at formation is most important
- Spirals are converted into S0s, in an ongoing process which depends
on density (still to be identified)
- These results are broadly consistent with the "Butcher-Oemler Effect"
(1978)
in which the fraction of blue galaxies is found to be higher in distant
clusters
(e) Caveat
This is an active area of research, with many details and uncertainties.
The outline I have given here is cleaner than the true situation at this time.
(8) Luminosity Functions
We have looked at the Luminosity function for cluster galaxies in Topic
4
Recall : the cluster LF can be constructed by combining
the LFs for each galaxy type
Ellipticals : Gaussian skewed to high luminosities
Spirals and S0s : Gaussian
dE's : Schechter function with steep slope
dSp/dIrr : Schechter function with shallower slope
For increasing densities :
the contribution of Es, S0s and dEs increases
the contribution of Spirals and dIrr decreases.
(9) cD Galaxies
cD galaxies are anomalies in the galaxy population :
- very luminous Elliptical galaxies
LcD 10×L*
which is unusually bright
They contribute to the LF above the normal exponential cutoff in the
Schechter function
Significantly more luminous than expected from the population of other
cluster galaxies (ie a statistical anomaly)
cD galaxies have a qualitative different
formation history than other cluster galaxies
- always found at the cluster center at the projected local
density maximum
they have essentially zero velocity w.r.t. the cluster mean
they lie at the cluster center of gravity
- very large with an extended halo (50 - 100 kpc in scale)
the light profile rises above the normal R¼ deVaucouleurs
law at large radii
The halo is usually oriented similarly to the overall cluster shape
velocity dispersion increases with radius to match the cluster dispersion
halo contains stars in the cluster potential
- Images often show double/triple merging nuclei within cDs :
[ image ]
- Origin : mergers of cluster galaxies in the cluster core
Since cluster velocities are so high, merging should be inefficient
occurred earlier ??
- cD galaxies can be at the center of a Cooling flow (see below)
These can be associated with significant emission line filaments (104 K
gas)
cD radio sources/jets are FR-I and exhibit significant interaction
with a high pressure IGM.
if cooling gas end up as stars, they may account for a significant
fraction of the cD mass.
(a few cDs do have patchy blue light (eg A 1795) -- but only a few)
(10) The Hot Inter-Cluster Medium (ICM)
Clusters are the most luminous extended X-ray sources in the Universe :
1043-46 erg/s
emission from
hot hydrostatic gaseous "atmosphere" : (107-8K)
(a) Simple Physics
(b) Hydrostatic Atmosphere & "Beta" Models
-
Given the hot ICM is radiating X-rays, how long will it take the
gas to cool down ?
Cooling time = Thermal capacity / cooling rate
tcool = 3 Ne k T /  = 1011 Ne-1 T½ sec
= 2.7×10¹⁰ Ne,3-1 T7½ yr
= 1011 Ne-1 T½ sec
= 2.7×10¹⁰ Ne,3-1 T7½ yr
This is longer than tHubble except, possibly, at the center.
the gas remains hot, even with
no additional heating
-
Sound speed : cs
103 km/s Vgals
Sound crossing time : ts-cross 109 years << 1010 years
the atmosphere can adjust to the potential
and achieve equilibrium
we have a hydrostatic atmosphere
- What is the structure of such an atmosphere : ie what is
gas(r) and Tgas(r) ?
The appropriate equations for hydrostatic support and the equation of state are :
dPgas / dr = -G M(<r) / r2 ×
gas
and
Pgas = nkT =
gas kT /  mp
mp
Which together give :
(1 / gas) d gas(kT/µmp) / dr =
- GM(<r) / r2
Obviously, we can view this in two ways :
knowing gas and Tgas we can
derive M(r) ultimately very important (§11)
knowing M(r) or its equivalent (and assuming T), we can derive
gas(r)
-
Although we dont know M(r) we do have another tracer of
 : the galaxies
Since galaxies are collisionless
they obey an equivalent equation (T8.8.c.i eq 8.37b)
(1 / gal) d ( galr,gal2 ) / dr +
2  r,gal / r
= - GM(<r) / r2
r,gal / r
= - GM(<r) / r2
(Here, referes to orbit anisotropy and r,gal is the radial galaxy dispersion)
notice that in both these equations we do not assume that either
gal or gas define the potential
(they dont, the dark matter does)
The gas and galaxies do, however, sample the same potential
-
To proceed, we make three assumptions :
- the galaxies have isotropic orbits :
= 0, so
r,gal
 gal
gal
- the galaxies are isothermal : gal
=
const
- the gas is isothermal : T = const
Notice that we do not assume Tgas = Tgals
Since Tgas  Tgals we expect
a different (but still isothermal) profile for the gas.
Tgals we expect
a different (but still isothermal) profile for the gas.
Combining the hydrostatic fluid and stellar equations, we get :
(13.1)
from which we see :
gas gal
with =
gal2 / (kT/µmp)
= Tgal / Tgas
Here refers to Tgal / Tgas (and should not be confused with the anisotropy
parameter)
-
One approach is to compare Ngal(R) with
SX(R) to extract and test
the various assumptions.
Early on, considerable effort went into this but ultimately firm conclusions
were illusive :
- too few galaxies to get smooth N(R)
- deprojection amplifies uncertainties in both
gas(r) and gal(r)
- unknown mass segregation may render gal
not constant
-
Instead, the above reasoning is assumed to be valid, and an isothermal profile
is adopted directly.
An adequate approximation is the "Analytic King Profile"
gal
(1 + (r / rc)2 ) -3/2
so
gas
(1 + (r / rc)2 ) (-3/2)
recall, from T5 and T8.10.b.ii, that this is in fact the density law behind the "Hubble Profile"
it does not fit the isothermal r-2 profile at large radii, but
it does fit the general isothermal profile within a few core radii.
One nice advantage, however, is that all integrals are analytic (including deprojections)
-
Fits to X-ray brightness profiles are reasonably good, except :
- when substructure is strong (not hydrostatic)
- at the centers when a cooling flow occurs (see §10e)
Fits yeild 0.7 (rich clusters)
0.4 (less rich clusters)
giving halo gas density gradients r-1 (rich clusters)
r-0.7 (less rich clusters)
-
In terms of gas temperature : Tgas / Tgal
-1
1.5 (rich)
2 (less rich)
It seems the gas is hotter than the galaxies,
the temperature difference is greater for shallower potentials.
These results are also supported by (spectroscopic)
measurements of Tgas
conclusion : There is a non-gravitational source of heating for the ICM.
What is it ? not yet known
Possibilities include :
- AGN jets (in the past, not current radio sources)
- Starburst driven superwinds
- Shocks arising from cluster mergers
- Early inhomogeneous ICM : cooler parts become galaxies, hotter parts stay ICM
(c) X-ray Correlations
Given that X-rays arise from a hydrostatic atmosphere, we expect (and find) correlations
with other measures of potential depth.
- LX increases with increasing central galaxy density
- LX increases with increasing E/S0/Sp fraction
- Tgas increases with LX (cluster potential depth)
- Mgas / Mgal increases with LX and T
gas retained in deeper potentials
- Metallicity increases with lower LX & T
greater loss of primordial gas
(d) Abundances (and Temperatures)
(e) Cooling Flows
(f) Radio Sources & the ICM
WATs & NATs
Radio halos & the link to ICM shocks
Not yet written up
(g) ICM Substructures and Cluster Mergers
Not yet written up
(11) Cluster Masses
There are a number of methods for measuring the gravitational field in clusters
To some extent, this topic overlaps with Topic 17 on Dark Matter and Gravitational
Lensing
So we will be quite brief here.
- Galaxy Velocities :
Assuming clusters to be in gravitational equilibrium, we can use the Virial Theorem :
<KE> = -½<PE>
<v2> =  GMclus /
Rclus
( 1 depending
on orbit geometry)
GMclus /
Rclus
( 1 depending
on orbit geometry)
Zwicky (1933) was the first to apply this (to Coma) and recognised that Mclus >>
Mgals
at the time, interpretation was unclear since it was not known if clusters were
in gravitational equilibrium
The result was controversial until the 1970s when evidence for dark matter began
to build
Today, Zwicky's approach has been vindicated, though there are still some caveats :
a well sampled velocity field is rare (usually too few galaxy redshifts measured)
eliminating foreground/background galaxies is difficult (though velocity outliers are influencial)
orbits of galaxies are unknown (so is not well known;
cf Topic 13 measuring BH masses)
- Hydrostatic Hot Gas
Since the hot ICM is hydrostatically supported, its structure is defined by
the potential :
(1 / gas) d Pgas / dr
= - GM(<r) / r2
This requires measuring :
gas(r) from X-ray images
(eg ROSAT; XMM; Chandra)
Tgas(r) from X-ray spectra (eg ASCA; Chandra)
This method also has some caveats :
Presently, spatial resolution is poor for spectra (hopefully Temp gradients are
slight)
There may be both small and/or large scale inhomogeneities in the ICM
- Gravitational Lensing
The light from distant galaxies is deflected (slightly) by the gravitational field
of the cluster
Image distortion
projected, total mass density :
tot
=  tot dl
There are two rather different regimes :
- Results Summary
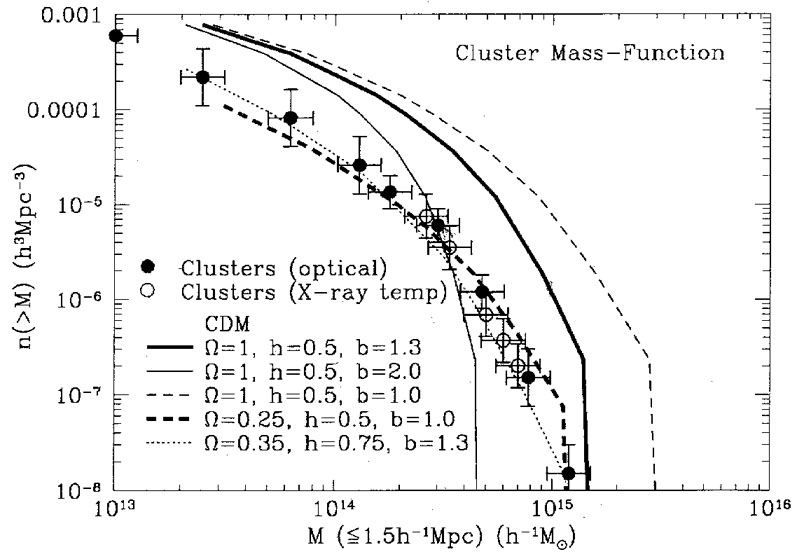
Naturally, there is a range of cluster masses found
Here is the cluster mass function :

Total masses range over 1014 - 1015
M with fewer of higher mass
More important are mass ratios : Mtot is typically
4 × Mgas + gals
Comparing the mass to the galaxy light : (M / LB) 200 M /
LB,
this is much larger than the optical part of
individual galaxies (1-10 depending on type)
This provides some of the strongest evidence for Dark Matter.
Oort (1958) first suggested that cluster M/L ratios were representative of
the Universe as a whole
Using a total galaxy luminosity density and a typical cluster M/L ratio we find
matter
0.2
If the gas and galaxies comprise all the baryonic matter
in the cluster, we then expect baryons
0.06
which is nicely consistent with the value from cosmic nucleosynthesis.
As you probably know, a variety of methods have established that we are in
a flat universe, with :
total 1 which itself comprises
vacuum 0.7;
matter
0.3 ; baryons
0.04
Clusters have played an important role in establishing these cosmological numbers
 103 total galaxies
  =
10-11 T-½ exp(-E/kT) ne nZ
Z2 g(E) erg/s/cm3/erg
=
10-11 T-½ exp(-E/kT) ne nZ
Z2 g(E) erg/s/cm3/erg