Spectrum Analyzer
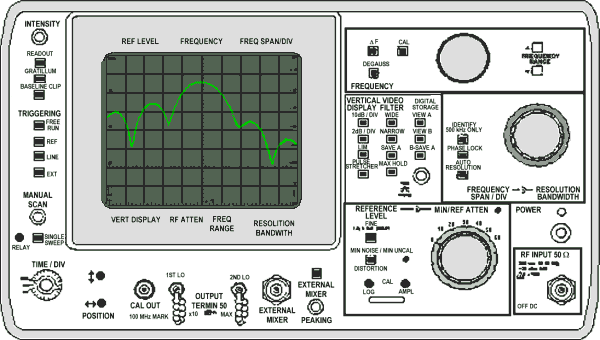
The spectrum analyzer is used to examine the frequency spectrum of radar transmissions, local oscillators, test sets, and any other equipment operating within its testable frequency range. With experience, you will be able to determine definite areas of malfunctioning components within equipment. Successful spectrum analysis depends on the proper operation of a spectrum analyzer and your ability to correctly interpret the displayed frequencies.
The spectrum analyzer accepts an electrical input signal and displays the frequency and amplitude of the signal on a CRT. On the vertical, or Y, axis, the amplitude is plotted. The frequency would then be found on the horizontal, or X, axis. The overall pattern of this display indicates the proportion of power present at the various frequencies within the spectrum (fundamental frequency with sideband frequencies).

Figure 1: Spectrum Analyzer Tektronix, Model 492

Figure 1: Spectrum Analyzer Tektronix, Model 492
(Please hold the mouse-pointer at the object of interest!)
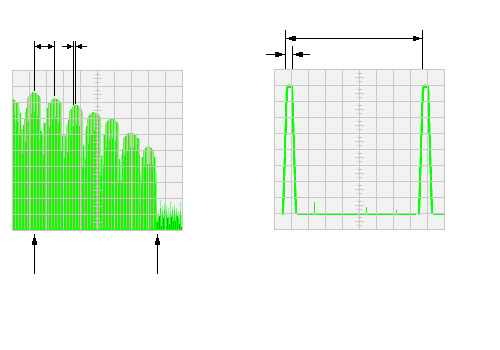
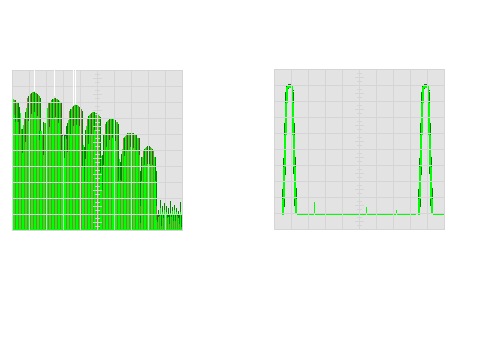
Radar transmitting impulses can better measured with a spectrumanalyzer than with an oscilloscope. The nominal Tx-frequency, the bandwidth, pulse with (PW) and pulse repetition time (PRT) can be detected from the announced signal. (The upper half of the signal is shown in the graphic only.) Often the oscilloscope cannot display even the high frequency, therefore only a demodulated videosignal is shown here.

frequency
of the band filter
Figure 2: Comparison of a spectrum analyzer and an oscilloscope display

frequency
of the band filter
Figure 2: Comparison of a spectrum analyzer and an oscilloscope display
