Frequency-Modulated Continuous-Wave Radar (FMCW Radar)
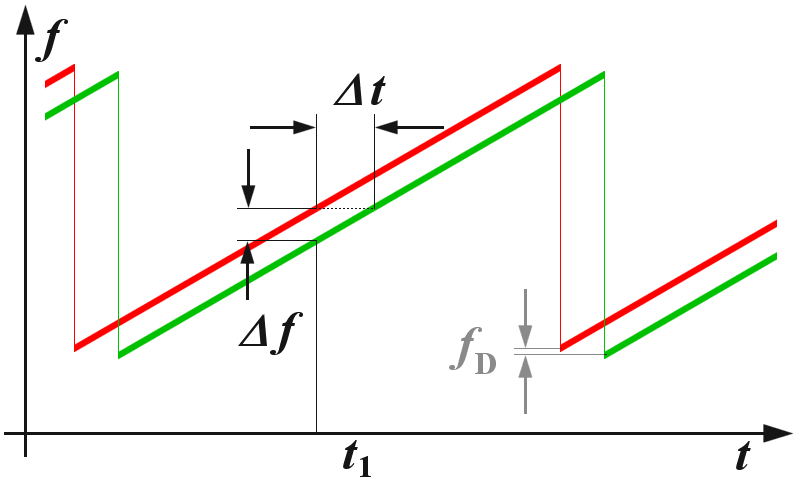
echo signal
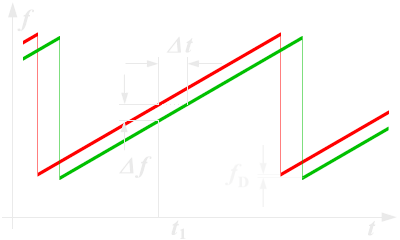
Figure 1: Ranging with an FMCW system
Frequency-Modulated Continuous-Wave Radar (FMCW Radar)
FMCW radar (Frequency-Modulated Continuous Wave radar = FMCW radar) is a special type of radar sensor which radiates continuous transmission power like a simple continuous wave radar (CW-Radar). In contrast to this CW radar FMCW radar can change its operating frequency during the measurement: that is, the transmission signal is modulated in frequency (or in phase). Possibilities of Radar measurements through runtime measurements are only technically possible with these changes in the frequency (or phase).
Simple continuous wave radar devices without frequency modulation have the disadvantage that it cannot determine target range because it lacks the timing mark necessary to allow the system to time accurately the transmit and receive cycle and to convert this into range. Such a time reference for measuring the distance of stationary objects, but can be generated using of frequency modulation of the transmitted signal. In this method, a signal is transmitted, which increases or decreases in the frequency periodically. When an echo signal is received, that change of frequency gets a delay Δt (by runtime shift) like to as the pulse radar technique. In pulse radar, however, the runtime must be measured directly. In FMCW radar are measured the differences in phase or frequency between the actually transmitted and the received signal instead.
The basic features of FMCW radar are:
- Ability to measure very small ranges to the target (the minimal measured range is comparable to the transmitted wavelength);
- Ability to measure simultaneously the target range and its relative velocity;
- Very high accuracy of range measurement;
- Signal processing after mixing is performed at a low frequency range, considerably simplifying the realization of the processing circuits;
- Safety from the absence of the pulse radiation with a high peak power.
Principle of measurement
Characteristics of FMCW radar are:
- The distance measurement is accomplished by comparing the frequency of the received signal to a reference (usually directly the transmission signal).
- The duration of the transmitted waveform T is substantially greater than the required receiving time for the installed distance measuring range.
The distance R to the reflecting object can be determined by the following relations:
| R = | c0 · |Δt | | = | c0 · |Δf | | Where: | c0 = speed of light = 3·108 m/s Δt = delay time [s] Δf = measured frequency difference [Hz] R = distance between antenna and the reflecting object (ground) [m] df/dt = frequency shift per unit of time |
(1) |
| 2 | 2 · (df/dt) | |||||
If the change in frequency is linear over a wide range, then the radar range can be determined by a simple frequency comparison. The frequency difference Δf is proportional to the distance R. Since only the absolute amount of the difference frequency can be measured (negative numbers for frequency doesn't exist), the results are at a linearly increasing frequency equal to a frequency decreasing (in a static scenario: without Doppler effects).
If the reflecting object has a radial speed with respect to the receiving antenna, then the echo signal gets a Doppler frequency fD (caused by the speed). The radar measures not only the difference frequency Δf to the current frequency (caused by the runtime), but additional a Doppler frequency fD (caused by the speed). The radar then measures depending on the movement direction and the direction of the linear modulation only the sum or the difference between the difference frequency as the carrier of the distance information, and of the Doppler frequency as a carrier of the velocity information. If the measurement is made during a falling edge of a saw tooth (see right part of Figure 3), then the Doppler frequency fD is subtracted of by the runtime frequency change. If the reflecting object is moving away from the radar, then the frequency of the echo signal is reduced by the Doppler frequency additionally. Now, if the measurement is performed with a sawtooth as shown in Figure 1, then the received echo signal (the green graph) is moved not only by the run time to the right but also by the Doppler frequency down. The measured difference frequency Δf is by the Doppler frequency fD higher than according to the real run time should be.
Maximum Range and Range Resolution
By suitable choice of the frequency deviation per unit of time can be determined the radar resolution, and by choice of the duration of the increasing of the frequency (the longer edge of the red sawtooth in Figure 1), can be determined the maximum non-ambiguous range. The maximum frequency shift and steepness of the edge can be varied depending on the capabilities of the technology implemented circuit.
The maximum unambiguous range is determined by the necessary temporal overlap of the (delayed) received signal with the transmitted signal. This is usually much larger than the energetic range, i.e. the limitations by the free space loss.
For the range resolution of an FMCW radar, the bandwidth BW of the transmitted signal is decisive (as in so-called chirp radar). However, the technical possibilities of Fast Fourier Transformation are limited in time (i.e. by the duration of the sawtooth Τ ). The resolution of the FMCW radar is determined by the frequency change that occurs within this time limit.
| ΔfFFT = | 1 | = | δ(f) | mit: | ΔfFFT = smallest measurable frequency difference δ(f)/δ(t) = Steepness of the frequency deviation fup = upper frequency (end of the sawtooth) fdwn = lower frequency (start of the sawtooth) |
(2) |
| Τ | δ(t)·(fup − fdwn) | |||||
The reciprocal of the duration of the sawtooth pulse leads to the smallest possible detectable frequency. This can be expressed in the equation (1) as |Δf | and results in a range resolution capability of the FMCW radar.
For example, a given radar with a linear frequency shift with a duration of 1 ms, can provide a maximum unambiguous range of less than 150 km theoretically. This value results from the remaining necessarily overlap of the transmission signal with the echo signal (see Figure 1) to get enough time for measuring a difference frequency. Most this range can never be achieved due to low power of the transmitter. Thus always remains enough time for a measurement of the difference frequency.
If the maximum possible frequency shift for the transmitter’s modulation is 250 MHz, then depending on this edge steepness a delay time of 4 ns obtains 1 kHz frequency difference. This corresponds to a range resolution of 0.6 m.
This example shows impressively the advantage of the FMCW radar: A pulse radar must measure these 4 ns delay difference, resulting in a considerable technical complexity. A difference in frequency of 1 kHz, however, is much easier to measure because it is in audio range.
The signal bandwidth of an FMCW radar can range from 1 MHz to several GHz. (Its upper border is mostly limited by administrative reasons. For example the mostly used for FMCW-applications European ISM-radio band is defined from 24,000 MHz to 24,250 MHz with a given band width of 250 MHz.) As the bandwidth increases, the achievable range resolution is decreasing and this means the monitored objects can be seen more accurate. The maximum detected range becomes smaller when the bandwidth increases. This can be shown in the following table:
| Bandwidth | Range Resolution |
Maximum Range |
approximately required tx power |
Example given |
|---|---|---|---|---|
| 400 kHz | 4,000 m | 120 km | 1,4 kW | 76N6 (“Clam Shell”) |
| 50 … 500 kHz | 1,500 … 100 m | 15 … 250 km | 30 W | OTH oceanography radar WERA |
| 1 MHz | 150 m | 75 km | 1.4 … 4 kW | Naval radar using a Magnetron |
| 2 MHz | 75 m | 37.5 km | ||
| 10 MHz | 5 m | 7,500 m | ||
| 50 MHz | 3 m | 500 m | 4 mW | DPR-886 |
| 65 MHz | 2.5 m | 1,200 m | 100 mW | Broadband Radar™ |
| 250 MHz | 0.6 m | 500 m | 4 mW | Skyradar Basic II |
| 8 GHz | 3.5 cm | 9 m | 4 mW | Skyradar PRO |
| 7 GHz | 2.1 mm | 5 m | 4 mW | Omniradar RIC60A |
Table 1: Relationship between bandwidth and other parameters.
As with any radar in the FMCW radar, besides the allocated bandwidth, the antenna beamwidth determines the angular resolution in detecting objects.
Modulation pattern
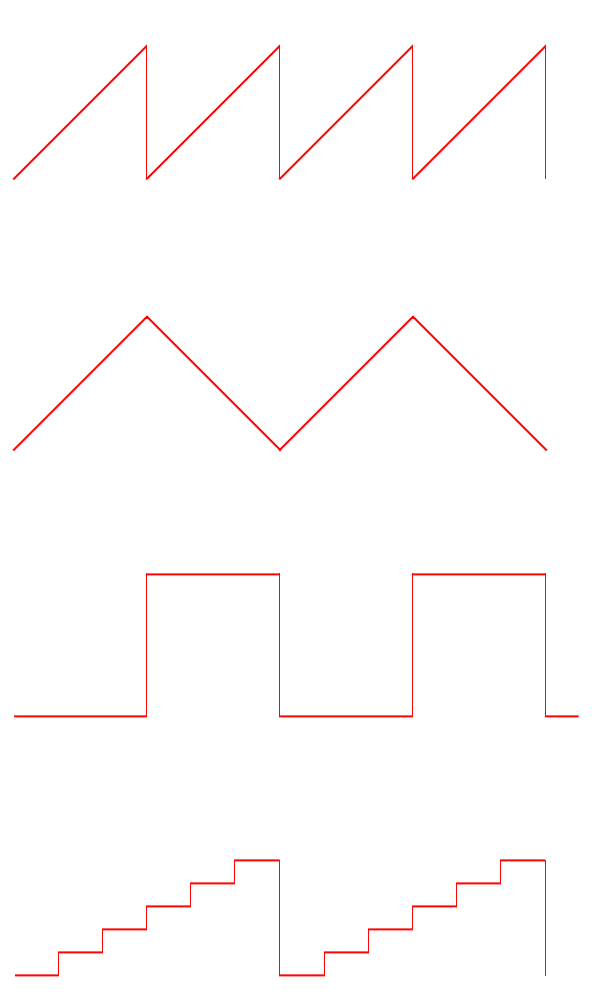
Figure 2: Common modulation pattern for an FMCW radar

Figure 2: Common modulation pattern for an FMCW radar
There are several possible modulation patterns which can be used for different measurement purposes:
- Sawtooth modulation
This modulation pattern is used in a relatively large range (maximum distance) combined with a negligible influence of Doppler frequency (for example, a maritime navigation radar). - Triangular modulation
This modulation allows easy separation of the difference frequency Δf of the Doppler frequency fD - Square-wave modulation (simple frequency-shift keying,
FSK)
This modulation is used for a very precise distance measurement at close range by phase comparison of the two echo signal frequencies. It has the disadvantage, that the echo signals from several targets cannot be separated from each other, and that this process enables only a small unambiguous measuring range. - Stepped modulation (staircase voltage)
This is used for interferometric measurements and expands the unambiguous measuring range. - Sinusoidal modulation
Sinusoidal modulation forms have been used in the past. These could be easily realized by a motor turning a capacitor plate in the resonance chamber of the transmitter oscillator. The radar then used only the relatively linear part of the sine function near the zero crossing.
Sawtooth linear frequency changing
In a linear sawtooth frequency changing (see Figure 1) a delay will shift the echo signal in time (i.e. to the right in the picture). This results in a frequency difference between the actual frequency and the delayed echo signal, which is a measure of the distance of the reflecting object. This frequency difference is called “beat frequency”. An occurring Doppler frequency would now move the frequency of the entire echo signal either up (moving towards the radar) or down (moving away from the radar).
In this form of modulation, the receiver has no way to separate the two frequencies. Thus, the Doppler frequency will occur only as a measurement error in the distance calculation. In the choice of an optimum frequency sweep can be considered a priori, that the expected Doppler frequencies are as small as the resolution or at least, that the measurement error is as small as possible.
.print.jpg)
echo signal
Figure 3: Relationships with triangular modulation pattern
This will be the case for example in maritime navigation radar: Boats move in the coastal area at a limited speed, with respect to each other perhaps with a maximum of 10 meters per second. In this frequency band of these radar sets (X-Band mostly), the expected maximum Doppler frequency is 666 Hz If the radar signal processing uses a resolution in the kilohertz range per meter, this Doppler frequency is negligible. Because the at an airfield occurring take-off and landing speeds of up to 200 m/s, a maritime navigation FMCW radar would have trouble at all to see these planes. The measurement error caused by the Doppler frequency can be greater than the distance to be measured. The target signs would then theoretically appear in a negative distance, i.e. before the start of the deflection on the screen.
Triangular frequency changing
In a triangular-shaped frequency changing, a distance measurement can be performed on both the rising and on the falling edge. In Figure 3, an echo signal is shifted due to the running time compared to the transmission signal to the right. Without a Doppler frequency, the amount of the frequency difference during the rising edge is equal to the measurement during the falling edge.
A Doppler frequency shifts the echo signal in height (green graph in the figure 3). It appears the sum of the frequency difference Δf and the Doppler frequency fD at the rising edge, and the difference between these two frequencies at the falling edge. This opens up the possibility of making an accurate distance determination, despite the frequency shift caused by the Doppler frequency, which then consists of the arithmetic average of the two parts of measurements at different edges of the triangular pattern. At the same time the accurate Doppler frequency can be determined from two measurements. The difference between the two difference frequencies is twice the Doppler frequency. Since the two differential frequencies, however, are not simultaneously available, this comparison requires digital signal processing, with intermediate storage of the measured results.
The Doppler frequency-adjusted frequency for the distance determination and the Doppler frequency of a moving target is calculated by:
| f (R) = | Δf1 + Δf2 | mit |
f (R) = frequency as a measure of distance determination fD = Doppler frequency as a measure of the speed measurement Δf1 = frequency difference at the rising edge Δf2 = frequency difference at the falling edge |
(2),(3) |
| 2 | ||||
| fD = | |Δf1 - Δf2| | |||
| 2 |
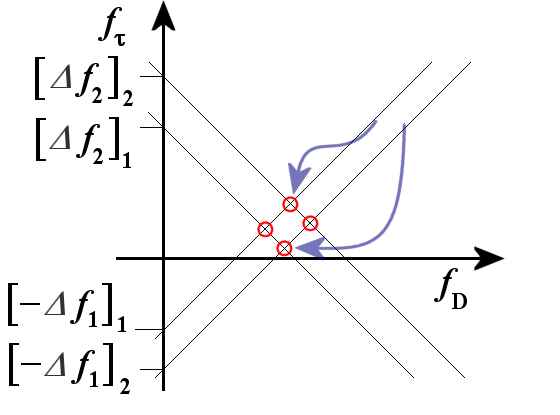
Figure 4: Ghost targets, graphical solution
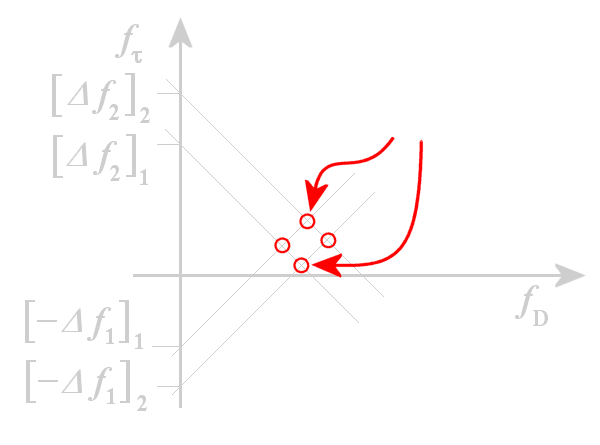
Figure 4: Ghost targets, graphical solution
The frequency f (R) can then be used in the formula (1) to calculate the exact distance.
However, this method has the disadvantage that, if appear a plurality of reflective objects, the measured Doppler frequencies cannot be uniquely associated with a target. The assignment of the wrong Doppler frequency to a destination in the wrong distance can lead to ghost targets. In figure 4 a graphical solution is shown. The position of a first target results from the functions [-Δf1]1 + fD and [+Δf2]1 - fD. The intersection of the two lines is the position of the target 1. When a second object ([……]2) with a second Doppler frequency appears Just then both pairs of linear slopes give a total of four intersections, two of which are the ghost targets. The position of ghost targets also depends on the steepness of the modulation pattern. Therefore, the problem can be resolved by measuring cycles with different slope steepness’s: then there to be shown only those targets, of which the coordinates are measured in both cycles in the same position.
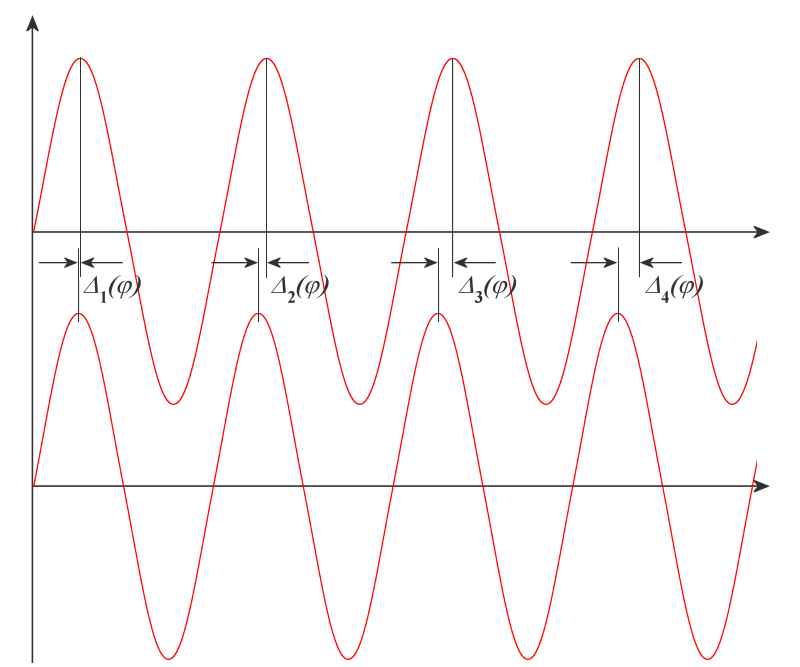
Figure 5: The phase difference Δn(φ) is a measure of how much wavelengths are equal to twice the distance (round trip)
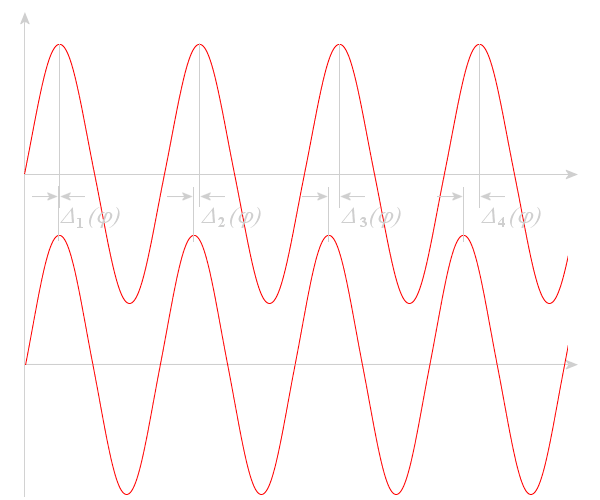
Figure 5: The phase difference Δn(φ) is a measure of how much wavelengths are equal to twice the distance (round trip)
Frequency Shift Keying (FSK)
The transceiver is simply switched back and forth with a rectangular control voltage between two transmission frequencies. There are two principal ways to process the output signals of the transceiver. The first possibility is to measure the duration of the frequency change. A signal appears at the output of the transceiver whose envelope is a pulse having a given pulse width as a measure for the distance. However, this measurement is a pure waste of time like the measurement of pulse radar and is therefore either inaccurate or technologically very complex.
A second possibility is to compare the phase angle of the echo signals of the two frequencies. During the pulse top of the rectangular pulse, the radar operates at the first frequency, and during the interpulse period the radar operates at the second frequency. During these times in the millisecond range, the radar will work as for CW radar method. The output of the down mixer (see block diagram), a DC voltage appears as a measure of the phase difference between the reception signal and its transmission signal. The phase difference between the echo signals of different transmission frequencies (technically: the voltage difference at the output of the mixer) is a measure of the distance. Again, both echo signals are not measured simultaneously, the voltage values must be stored digitally.
However, because of the periodicity of the sine wave, this method has only a very limited unambiguous measurement distance that is even this range; there the phase difference between the both echo signals is smaller than the half-wavelength. A frequency difference of 20 MHz between two transmission frequencies results in an unambiguous measuring range of 15 meters. Multiple targets at close range cannot be separated, since only one phase angle can be measured at the output of the mixer stage. Several targets overlap to only a single output voltage at which dominates the strongest target.
If both analysis methods (in time and in phase) are applied simultaneously, then the time-dependent distance determination can used to as a rough evaluation. The detailed results of the phase analysis can then be multiplied until the result is close enough to the distance from the measurement of time. The bad unambiguous maximum range of the measurement of phase difference is thus avoided.
Stepped frequency changing
In general, the same advantages and disadvantages of a stepped frequency modulation as the method with a square-wave modulation apply. However, the FMCW radar is now working with several successive frequencies. In each of these individual frequencies, a phase angle of the echo signal is measured. The unambiguous measurement range widens considerably, however, since now the phase relationships between several frequencies must be repeated to create ambiguities.
This method will be very interesting if resonances for individual component frequencies can be observed at the irregularities of the reflecting object. This measurement method is then a field of interferometry.
Block Diagram of an FMCW radar sensor
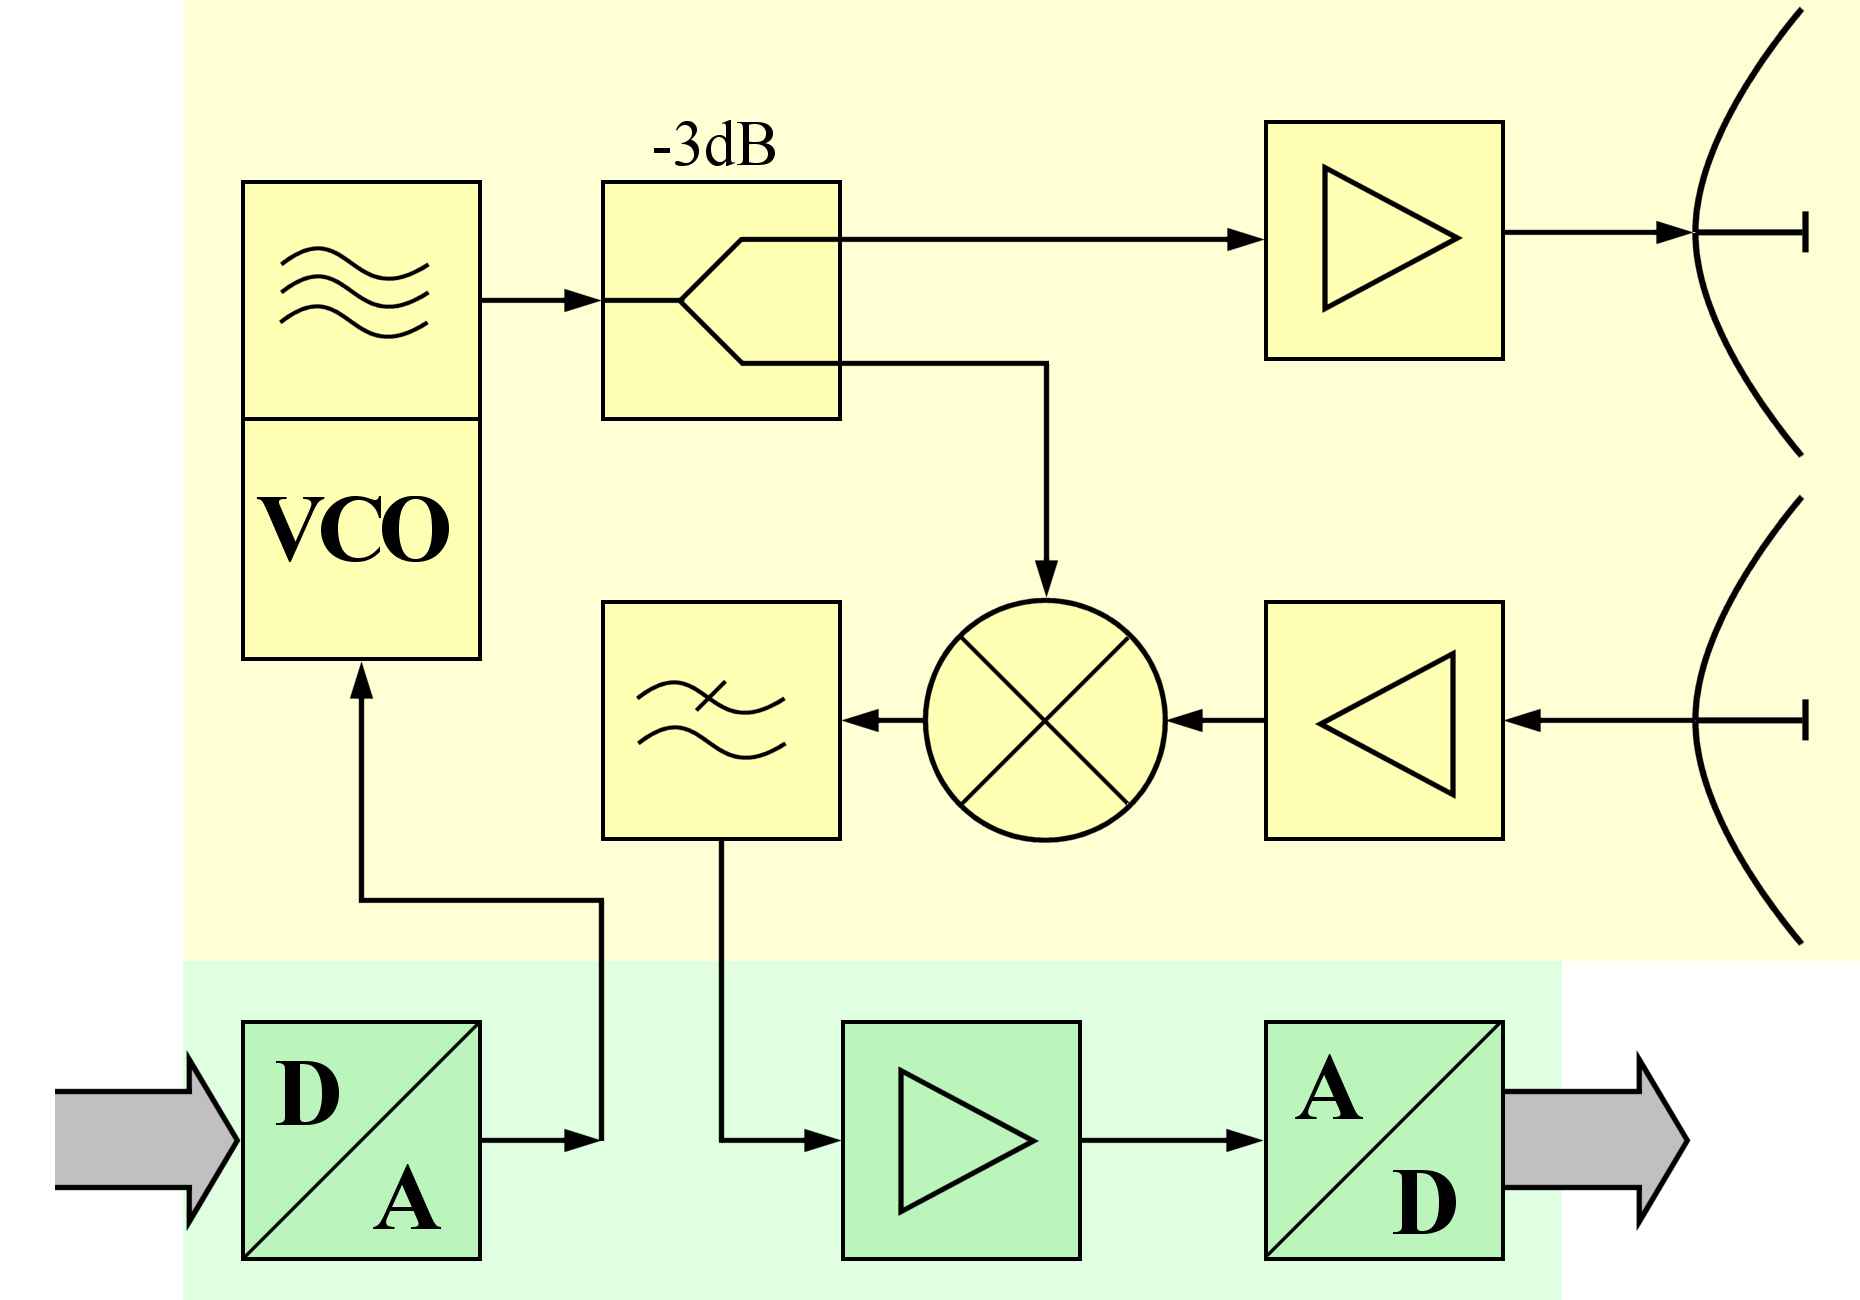
Figure 6: Block Diagram of an FMCW radar sensor
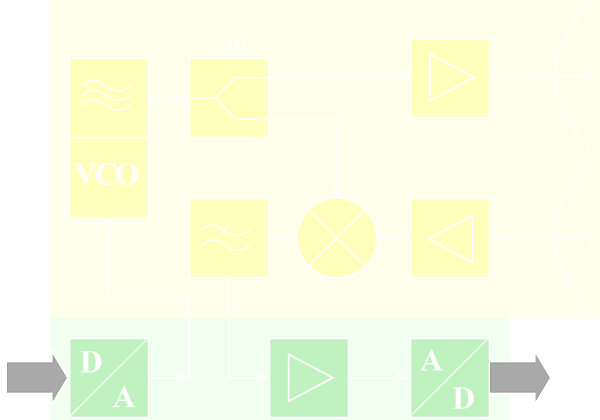
Figure 6: Block Diagram of an FMCW radar sensor (interactive picture)
An FMCW radar consists essentially of the transceiver and a control unit with a microprocessor. The transceiver is a compact module, and usually includes the patch antenna implemented as separate transmit and receive antenna. The high frequency is generated by a voltage controlled oscillator which directly feeds the transmitting antenna, or its power is additionally amplified. A part of the high frequency is coupled out and fed to a mixer which down converts the received and amplified echo signal in the baseband.
The control board contains a microprocessor that controls the transceiver, converts the echo signals in a digital format as well (usually via USB cable) ensures the connection to a personal computer or laptop. Using a digital to analog converter, the control voltage is provided to the frequency control. The output voltage of the mixer is digitized.
If using a single antenna, then due to the method (simultaneously transmitting and receiving) the FMCW radar needs a ferrite circulator to separate the transmitting and receiving signals. In the currently used patch antennas, however, the use of separate transmitting and receiving antennas is much cheaper. On a common substrate are placed directly above each other, a transmitting antenna array and a receiving antenna array. The polarization direction is rotated by 180° against each other often. Often is reduced by an additional shielding plate a direct "crosstalk" (ie a direct positive feedback between the two antennas). Since the measurement is performed as a frequency difference between the transmitting and receiving signal, the signal which is produced by this direct coupling can be suppressed due to the very small frequency difference.
In pure CW radar applications only the Doppler frequency must be processed. This includes frequencies only up to 16.5 kHz by using an FMCW transceiver operating in K-Band (about 24 GHz) and the expected speeds for recording are up to 360 kilometers per hour. Therefore as microprocessor there can be used a simple stereo audio processor, which is produced in large quantities and is used for example in sound cards for home computers. Even in the FSK method (rectangular pattern modulation) such a processor can be used conditionally.
In contrast, the receiver in a FMCW radar application must be able to process the whole transmitter's frequency shift. Thus frequencies up to 250 MHz are expected in the received signal. This has a significant impact on the bandwidth of the subsequent amplifier and the necessary sampling frequency of the analog-to-digital converter. Thus, the signal processing board of FMCW radar is considerably more expensive with respect to the CW radar.
There are currently on the market many inexpensive FMCW radar sensors or FMCW radar modules, which contain a complete transceiver with integrated patch antenna array as so-called “front-end” of FMCW radar device. These modules include as the core usually the MMIC module TRX_024_xx (see data sheet) from Silicon Radar with a power output of up to 6 dBm. This chip operates in the K-Band (24.0 … 24.25 GHz) and can be used as a sensor for speed and distance measurements. The modulation or a frequency change is dependent on a control voltage and is connected to an external circuit, which is either a fixed voltage (then operates the module as a CW radar), or it is controlled by a processor and based on the output voltage of a digital-analog converter. The output signal of the mixer is usually provided as I and Q signals, and needs to be substantially amplified before the analog-to-digital conversion.
Imaging FMCW radar
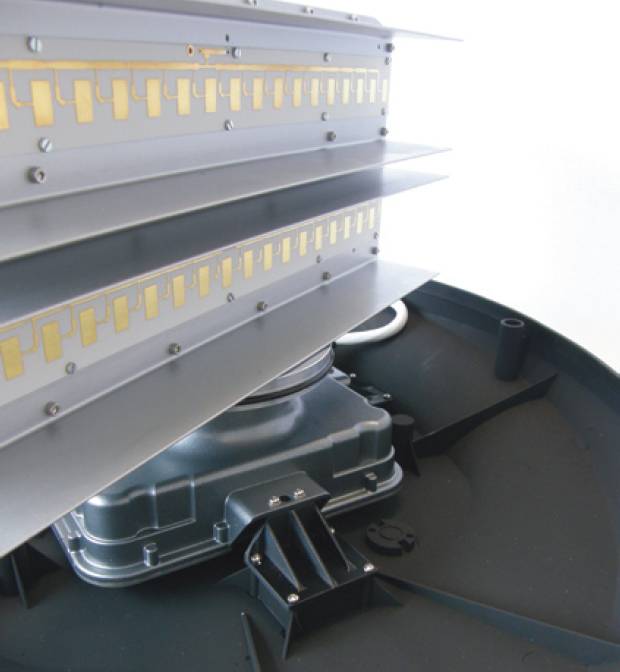
Figure 7: The patch antenna array of a maritime FMCW navigation radar in X-band
This radar method is used in the so-called Broadband Radar™ as navigational radar for maritime applications. Here, the frequency sweep is stopped, however, after reaching the maximum measurement range. Therefore, the transmission signal looks more like a signal of pulse radar using intrapulse modulation. This break has no direct influence on the maximum measuring distance here. However, it is necessary to read the measured data from a buffer, and to transmit them lossless through narrowband line to the display unit. Due to its operation - the frequency comparison of the received echo signal with the transmitted signal, which is available across the entire distance - it remains an FMCW radar, it will only intermittently switched off for a few milliseconds, as more data are simply not needed.
An imaging radar must perform a distance measurement for each point on the monitor. A range resolution that is more dependent here on the size of a pixel of this screen and from the ability of the signal processing to provide the data in the required speed. It is required a high-resolution screen with the pixel resolution, that as a minimum for each range difference two pixels must be available, so even if the measured signal is exactly between the position of two pixels, both pixels 'light up' and upon movement of the target, the number of pixels used, and thus the relative brightness of the target character is the same.
With the above as an example Broadband-Radar™ with a frequency shift of 65 MHz per millisecond you can get good measurements.
- For an unambiguous runtime measurement with this radar are measurable only a maximum of 500 µs (see Figure 1) which corresponds to a possible maximum range of 75 km.
- The frequency deviation of 65 MHz per millisecond corresponds to a frequency changing of 65 hertz per nanosecond. If the following filters are technically able to resolve differences in frequency of 1 kHz, then herewith a measuring of time differences of 15 nanoseconds is possible, which corresponds to a range resolution of about 2 meters.
- If the maximum processable by the evaluation difference frequency is two megahertz, which accomplish an easy one-chip microcomputer, then distances of up to 4000 meters can be measured. (Without a microcontroller would then need 4000 different individual filters operating in parallel.)
- Due to the measuring method here is the accuracy of measuring approximately equal to the range resolution and is still limited by the resolution of the screen scale.
The FMCW radar can thus obtain a high spatial resolution with little technical effort. To obtain the same resolution, a pulsed radar needs capable of measuring time in region of nanoseconds. That would mean that the band width of this pulse radar transmitter must be at least 80 MHz, and for digitization the echo signal needs a sampling rate of 166 MHz.
Non-imaging FMCW radar
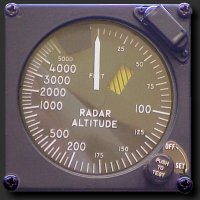
Figure 8: Analogue display of radar altimeter
The measurement result of this FMCW radar is presented either as a numeric value to a pointer instrument or digitized as alpha-numeric display on a screen. It can be measured only a single dominant object but this one with a very high accuracy down to the centimeter range. This method of distance determination is for example as used in aircraft radio altimeter.
Even an analog pointer instrument can serve as an indicator for an FMCW radar (see Figure 8). The moving coil meter has a greater inductive impedance for higher frequencies and therefore exhibits a value dependent on the frequency, which is then, however, not linear.

.png)
