Plot Extractor

Detector
I-channel
Q-channel
algorithm
Detector
Extractor
Processor
Combiner
SSR and PSR
Sources
frequency
video
video
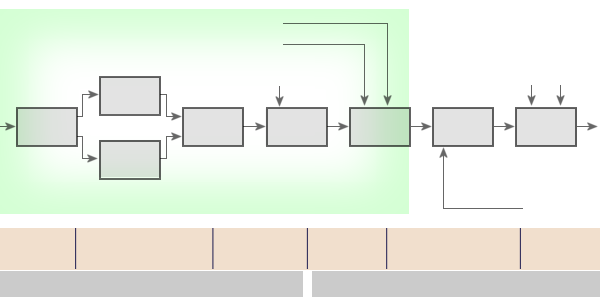
Figure 1: Part of the block diagram (information flow)

Detector
I-channel
Q-channel
algorithm
Detector
Extractor
Processor
Combiner
SSR and PSR
Sources
frequency
video
video
Figure 1: Part of the block diagram (information flow)
Plot Extraction is sometimes called Hit Processing.
The plot extractor takes the output of the signal processor i.e. the hits generated across the beamwidth and declares a plot position which may also include course and radial speed information. Plot extraction ranges from a simple position declaration to advanced hit processing, which takes the output of an MTI filter bank and generates plots taking account of amplitude information and Doppler.
As the antenna scans past any one target, there may be threshold crossings at one or more Doppler filter outputs, in several inter pulse periods, different CPIs and perhaps in adjacent range resolution cells. The function of the hit processor is to correlate all threshold crossings, grouping together all those which appear to come from the same target (can be 100 items for one target).
The hit processor generates target reports comprising range, azimuth, amplitude and radial velocity information, on all validated targets. The most common method of correlating hits to form a plot report is known as the sliding window process. More modern plot processors generally employ a more sophisticated correlation process - Centre of Mass Correlation.
The hit processor can make an assessment of plot energy based on the hit amplitude distribution across the beamwidth. This plot energy parameter is a valuable discriminator between targets and angels and is normally passed to the plot processor.
Hit processing functions are:
- Declare detection (given false alarm rate)
- Declare centriod posisition
- Declare radial speed
- Declare energy/amplitude (for removing angels)
