False Alarm Rate
A false alarm is “an erroneous radar target detection decision caused by noise or other interfering signals exceeding the detection threshold”. In general, it is an indication of the presence of radar target when there is no valid aim. The False Alarm Rate (FAR) is calculated using the following formula:
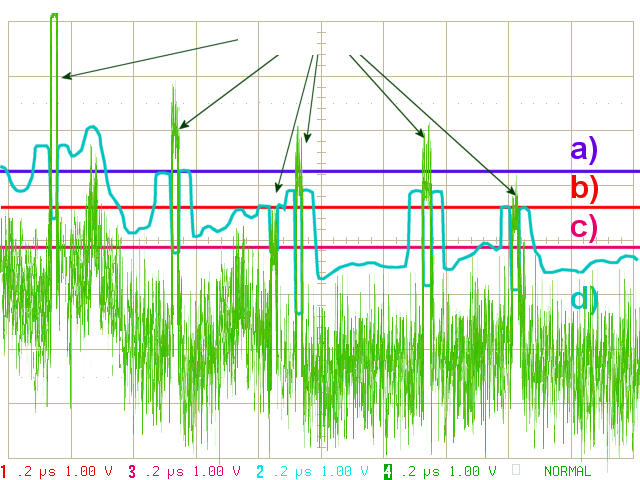
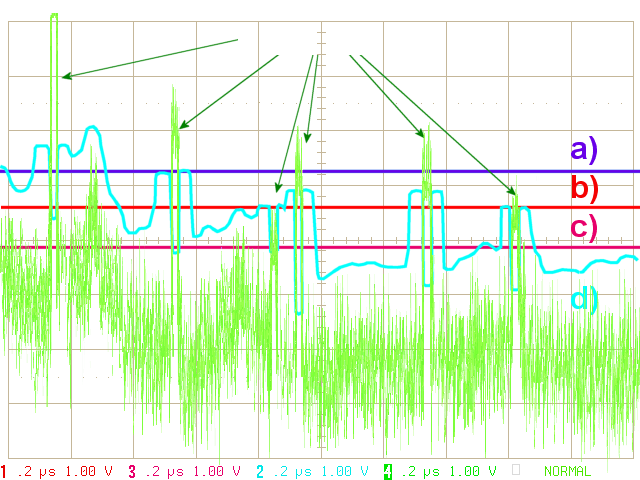
Figure 1: Different threshold levels
| FAR = | false targets per PRT | (1) |
| Number of rangecells |
False alarms are generated when thermal noise exceeds a pre-set threshold level, by the presence of spurious signals (either internal to the radar receiver or from sources external to the radar), or by equipment malfunction. A false alarm may be manifested as a momentary blip on a cathode ray tube (CRT) display, a digital signal processor output, an audio signal, or by all of these means. If the detection threshold is set too high, there will be very few false alarms but the signal-to-noise ratio required will inhibit detection of valid targets. If the threshold is set too low, the large number of false alarms will mask detection of valid targets.
- threshold is set too high: Probability of Detection = 66%
- threshold is set optimal: Probability of Detection = 83%
But one false alarm arises!
False alarm rate = 1 / 666 = 1,5 ·10-3 ¹) - threshold is set too low: a large number of false alarms arises!
- threshold is set variabel: constant false-alarm rate
The false alarm rate depends on the level of all interferences, like noise, clutter or jamming. Near the radar site the influence of the fixed clutter is higher than the noise level. At large distances the influence of the noise level is higher. This has the effect, that the false alarm rate depends on the range. But the equation doesn't give any range dependences. To achieve a higher probability of detection in large distances by using a lower threshold level, the false alarm rate rises at close range.
¹) for a Radar set with the maximum range of 100 km and a pulse width of 1,5 microseconds = 666 Rangecells
Constant False-Alarm Rate (CFAR)
video input
output
b) Greatest Of: CAGO-CFAR
c) Smallest Of: CASO-CFAR
Figure 2: Principle of a “Cell-averaging CFAR”- wiring
video input
output
b) Greatest Of: CAGO-CFAR
c) Smallest Of: CASO-CFAR
Figure 2: Principle of a “Cell-averaging CFAR”- wiring

video input
output
b) Greatest Of: CAGO-CFAR
c) Smallest Of: CASO-CFAR
Figure 2: Principle of a “Cell-averaging CFAR”- wiring.
The principle of a circuit for a constant false alarm rate was first described in 1968 by H. M. Finn and R. S. Johnson.[1]
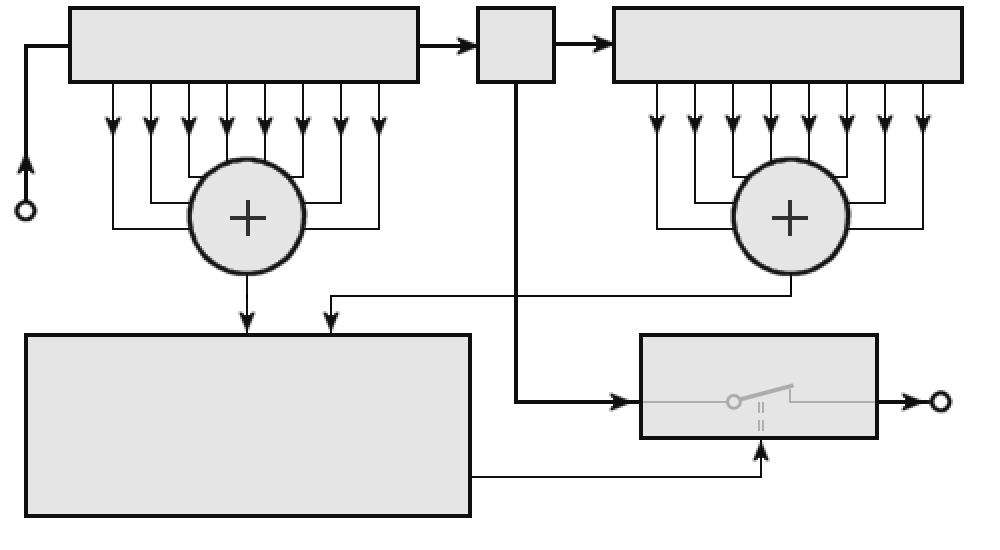
Solutions to the false-alarm problem involve implementation of constant false-alarm rate (CFAR) schemes that vary the detection threshold as a function of the sensed environment. Whilst there are a large number of types of CFAR circuit, they are usually based around the ‘background averager’ (sometimes referred to as cell averaging CFAR). A simplified block diagram is shown in Figure 2.
This circuit estimates the level of interference (noise or clutter) in radar range cells on either side of a range cell and uses this estimate to decide if there is a target in the cell of interest in the center. The process steps out one cell in range and is repeated until all range cells have been investigated.
The basis of the circuit is that when noise is present, the cells around the cell of interest will contain a good estimate of the noise in the tested cell, i.e. it assumes that the noise or interference is spatially or temporarily homogeneous. Theoretically the circuit will produce a constant false alarm rate, which is independent of the noise or clutter level so long as the noise has a Rayleigh distribution in all range cells investigated by the circuitry.
Cell-Averaging Constant False Alarm Rate (CA-CFAR)
In Figure 1 the graph d) denotes a customized profile of the threshold to the level of the noise floor. The interference at the beginning of the deflection, which would cause for the threshold a) a false alarm, also reaches a critical level here. However, the third echo signal, which is so weak that it would be lost even under the optimal threshold b), will be detected in the CFAR.
The circuit in Figure 2 shows a very simplified schematic. The sum-signs stand for the function as per the equation:
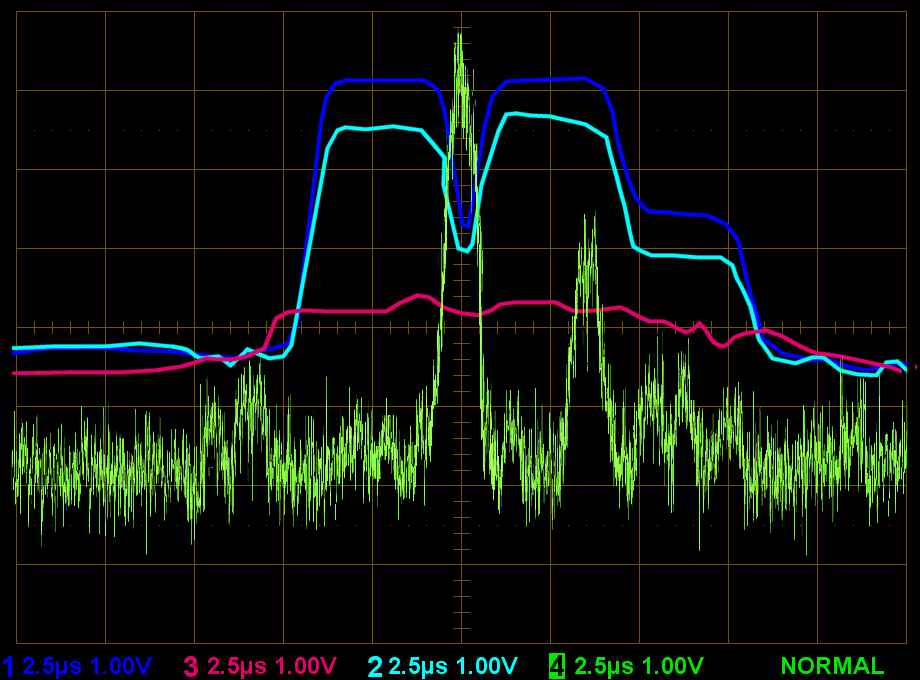
Figure 3: Comparing the thresholds of various CFAR method for the situation of two adjacent targets: the weaker target is hidden by the stronger one at the cell-averaging methods.[2]
Figure 3: Comparing the thresholds of various CFAR method for the situation of two adjacent targets: the weaker target is hidden by the stronger one at the cell-averaging methods.[2]
 (2)
(2)
In the CA-CFAR method this averaging is carried out in the device "arithmetic logic unit" too.
The CA-CFAR graph in Figure 3 shows strong values left and right of the target but at the target itself it has got a relatively low value. This can be quite easily explained by the schematic diagram. Shortly before and shortly after the range cell under test (RUT, sometimes called cell under test, CUT), the strong amplitude of the echo signal has an impact on the average. Therefore this one raises to its maximum. During the target itself, the average is made without the amplitude of the target. The threshold will be relatively low. The CFAR thus makes for strong targets a contrast enhancement. In a noise environment, very weak echo signals may be lost rather than in the case of a fixed threshold. One way to reduce these losses is, the both close to the RUT located cells not to include in the evaluation (in the circuit in Figure 2 indicated as dashed lines). These unused cells are then called guard cells. The remaining cells are called reference window cells.
CAGO-CFAR
In the case of Cell-Averaging Greatest Of-CFAR (CAGO-CFAR) the average power of clutter Z is estimated differently where both sides of the sliding window are analyzed separately. The threshold value is then defined by maximum selection between these two results. The value of Z for CAGO-CFAR is estimated as:


 (3)
(3)
Advantages of CAGO CFAR are the small required computing power and relatively low target losses. Compared to the CA-CFAR the treatment of non-homogeneous clutter environment is improved.
Disadvantages are: the overall still low effectiveness and the possibility (typical for all CA-CFAR variants) that two adjacent targets can cover each other (see Figure 3). There are also problems during an abrupt change in the disturbance signals (for example, on the edges of fixed clutter areas).
CASO-CFAR
The Cell-Averaging Smallest Of-CFAR (CASO-CFAR) uses the same circuit as the CAGO-CFAR. The one and only difference is that instead of the higher value of the output signal of both delay lines now the smaller one is used. The big level of the adjacent echo signal is thus usually not used for the threshold value calculation. The possibility that two adjacent target sign can cover each other, is therefore slightly reduced.
CAOS-CFAR or OS-CFAR
Since the previous methods cannot treat equally both extremes of the interference environment (homogeneous and non-homogeneous interference environment), the method of Ordered Statistic-CFAR (OS-CFAR) have been developed.[2] In the block diagram in Figure 2, the two logic symbols with the plus sign are replaced by a statistical method. The amplitude values taken from the reference windows are first rank-ordered according to decreasing magnitude. A certain number of the highest values will be excluded from further processing. It can be formed an average of the remaining values again (CAOS-CFAR), and/or additional weights are made, for example, depending on the average noise level (OS-CFAR).
Here can be done also a separate division in preceding and subsequent reference window cells. Their individual results can be selected again as Greatest Of (OSGO-CFAR) or Smallest Of (OSSO-CFAR) before further processing.[3]
Advantage of the OS-CFAR is the much better effectiveness of the preparation of the threshold. Adjacent echo signals can no longer cover each other. The major disadvantage of the OS-CFAR is the high processing power required for performing the sorting algorithm. This processing power must be provided during the real-time part of radar signal processing, since the threshold calculation is still ahead of target recognition.
CASH-CFAR
The so-called CASH CFAR (Cell Averaging Statistic Hofele) is also a statistical method which was developed by Franz Xaver Hofele, an employee of the former DASA (today Cassidian electronics).[4] It is based on a series of summating elements associated with each range cell and a specific maximum-minimum detector.[5] The advantage of the CASH-CFAR algorithm is that it avoids alternate covering and aggregation of objects. Their time side lobes resulting from the pulse compression are thereby reliably hidden by the threshold. The required processing power of the CASH-CFAR algorithm is also significantly less than that of the OS- and CAOS-CFAR algorithms with their rank-selection methods.
MAMIS-CFAR
The MAMIS-CFAR (MAximum MInimum Statistic) is essentially the same as the CASH-CFAR, except that a special maximum-minimum circuit replaces the adders of the CASH-CFAR (for example, as an FPGA chip). The characteristics of the MAMIS-CFAR are quite similar to those of the CASH-CFAR for the handling of block interference and of point- and extended targets.
Inverse False Alarm Rate
The false alarm rate can be converted into an inverse false alarm rate (IFAR) trivially by taking the inverse. It can be calculated as in equation (1), and then inverted. Another possibility of the calculation is over the time relation:
| IFAR = | 1 | = | T | = T·Btx | width: | FAR = False Alarm Rate T = Average interval between two false alarms Λ = Duration of the false alarm Btx = Transmitters pulse bandwidth |
(4) |
| FAR | Λ |
In the case of a simple keyed on/off modulated pulse radar, the duration of a false alarm Λ is equal to the length of the pulse. In the case of radar with intrapulse modulation, the duration of a false alarm can only be measured after the pulse compression. For this reason, there are also calculations into which the bandwidth Btx of the transmitters pulse is used as a measure for the pulse compression rate as well as for the possible range resolution.
Sources and ressorces:
- H. M. Finn and R. S. Johnson, “Adaptive detection mode with threshold control as a function of spacially sampled clutter-level estimates;” RCA Rev., vol. 29, pp. 141-464, September 1968.
- Rohling, Hermann “Ordered statistic CFAR technique - an overview”, Radar Symposium (IRS), 2011 Proceedings International, On page(s): 631 - 638, Volume: Issue: , 7-9 Sept. 2011
- Long Cai, Xiaochuan Ma, Qi Xu, Bin Li, Shiwei Ren “Performance Analysis of Some New CFAR Detectors under Clutter”, Journal of Computers, Vol 6, No 6 (2011), 1278-1285, Jun 2011 (doi:10.4304)
- F. X. Hofele, “An innovative CFAR algorithm,” in Proc. CIE Int. Conf. Radar, 2001, pp. 329–333.
- Patent DE 19600779 A1 Verfahren zur Erzeugung einer Clutter-Schwelle und Anordnungen zur Durchführung des Verfahrens

