Time-Domain versus Frequency-Domain
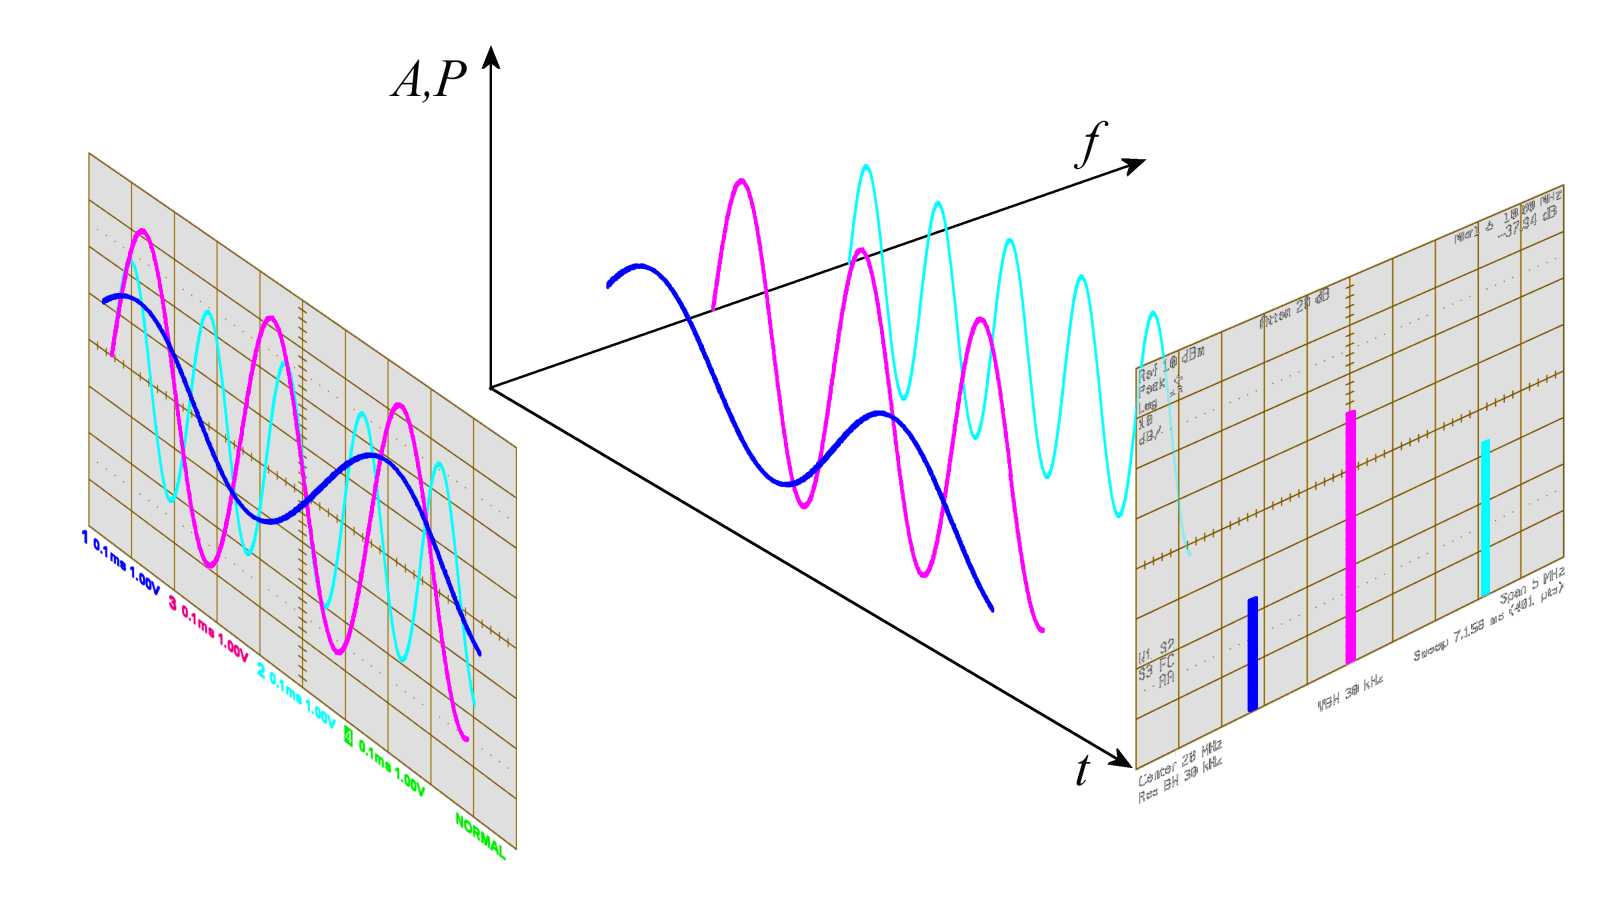
Figure 1: Three-dimensional representation of the viewing directions for the time domain and the frequency range
Figure 1: Three-dimensional representation of the viewing directions for the time domain and the frequency range
Time-Domain versus Frequency-Domain
There are primarily two ways of viewing any type of a wave; in the time domain, or in the frequency domain.
The time domain is the analysis of physical signals with respect to time. The horizontal axis is time, and is expressed in seconds or parts of it. A time-domain graph shows how a signal changes over time.
The frequency domain is the analysis of physical signals with respect to frequency. A frequency domain graph shows how much of the signal is within a given frequency band over a range of frequencies. The frequency domain is more compact and useful when we are dealing with more than one sine wave, i.e. with composite signals. For example, Figure 1 shows three sine waves, each with different amplitude and frequency. All can be represented by three spikes in the frequency domain.