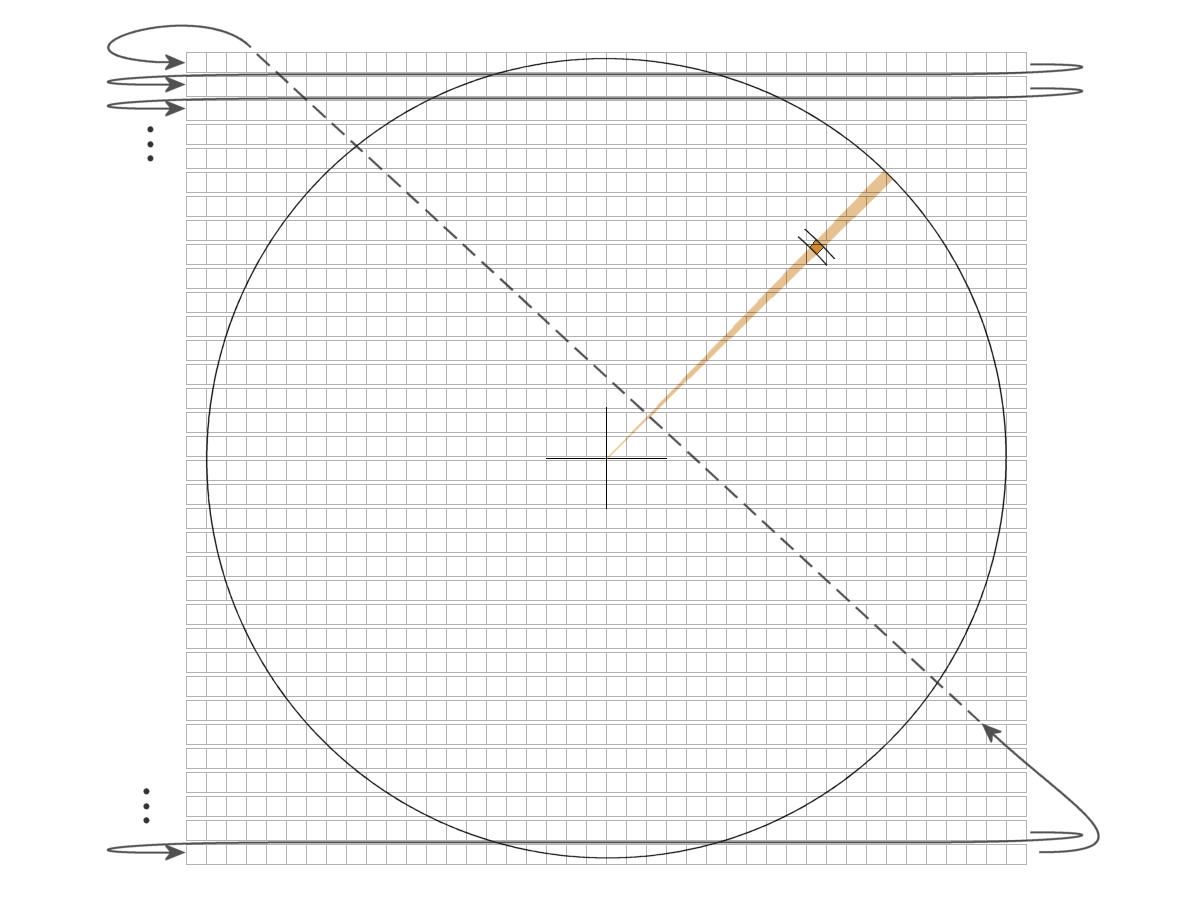
Figure 1: Pixel-Grid of a computer screen, the arrows indicate the order of writing to the memory of the video card.

Figure 1: Pixel-Grid of a computer screen, the arrows indicate the order of writing to the memory of the video card.

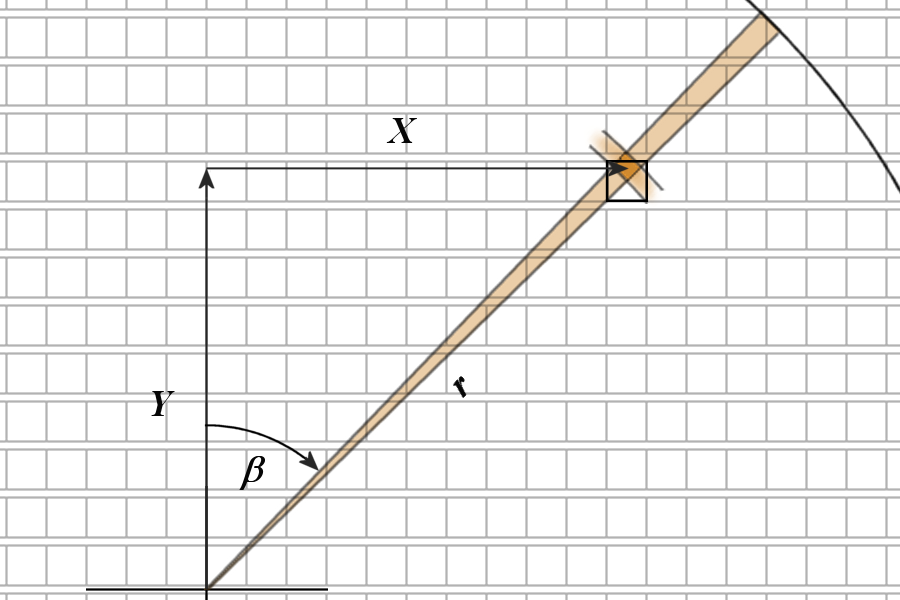
Figure 2: Rectangular triangle with the short sides X and Y, the hypotenuse r (range) and the azimuth angle β

Figure 2: Rectangular triangle with the short sides X and Y, the hypotenuse r (range) and the azimuth angle β
Radar Scan Conversion
A surveillance radar supplies its measured data in polar coordinates, i.e. in range-azimuth format (r,β). Radar scan conversion involves the transformation of data in a range-azimuth format to an x-y format for a raster-scan-scope.
The radar stores its raw data into a table. This table is also referred to as polar store or polar pixmap. The table columns represent all possible measurable range steps. Each table row represents a complete pulse period, which took place in a certain azimuth angle. The first line is the azimuth angle of 0°, ie: the north direction. In each cell of the table is a number representing the brightness of this cell on the screen. If this table would be represented as a bitmap without a signal conversion on a raster scan monitor, then it would represent a tilted by 90° B-scope. To generate a picture similar to a PPI-scope on a raster scan monitor with a line sequential image (like a television), this radar rawdata must first be converted in the X-Y-format. It must be calculated, in which row-number (Y ) which pixel (X ) should light up.
This conversion is a pure trigonometric calculation:
| X = r sin β + XC | (1) | |
| Y = r cos β + YC | ||
The values of (XC , YC) represents the site of the radar antenna, which usually is the center of the screen.
The table with the rawdata, however, the single range cells have a different size as function of their distance from the radar. Targets, which are on a PPI scope close to the radar site, are smaller than the targets on the screen edges. The calculations can already be quite inaccurate near the inflection points of the trigonometric functions. Therefore, the opposite approach is taken in practice: the so-called reverse processing. In a further table, an azimut angle and a range is stored for each pixel of each line of the monitor, which is closest to the values of the polar coordinate system. With these optimized values (Side angle corresponds to the line number; distance corresponds to the column number) the cell in the raw data table is determined, whose value is taken for the image in XY format.
With this radar signal conversion an additional inaccuracy in the determination of coordinates arises by the radar. The center of a cell in the raw data table rarely corresponds to the center of the pixel in the image line. The additional inaccuracy corresponds to a pixel size. The smaller the pixels are relative to the target size in the raw data table, the less these additional inaccuracy.
However, the smaller are these pixels, the more pixels light up to indicate a rather large target. Not every pixel should then get the full brightness of the target character. In a good software for radar signal converting the values for each pixel are weighted in order to avoid artifacts and holes.
